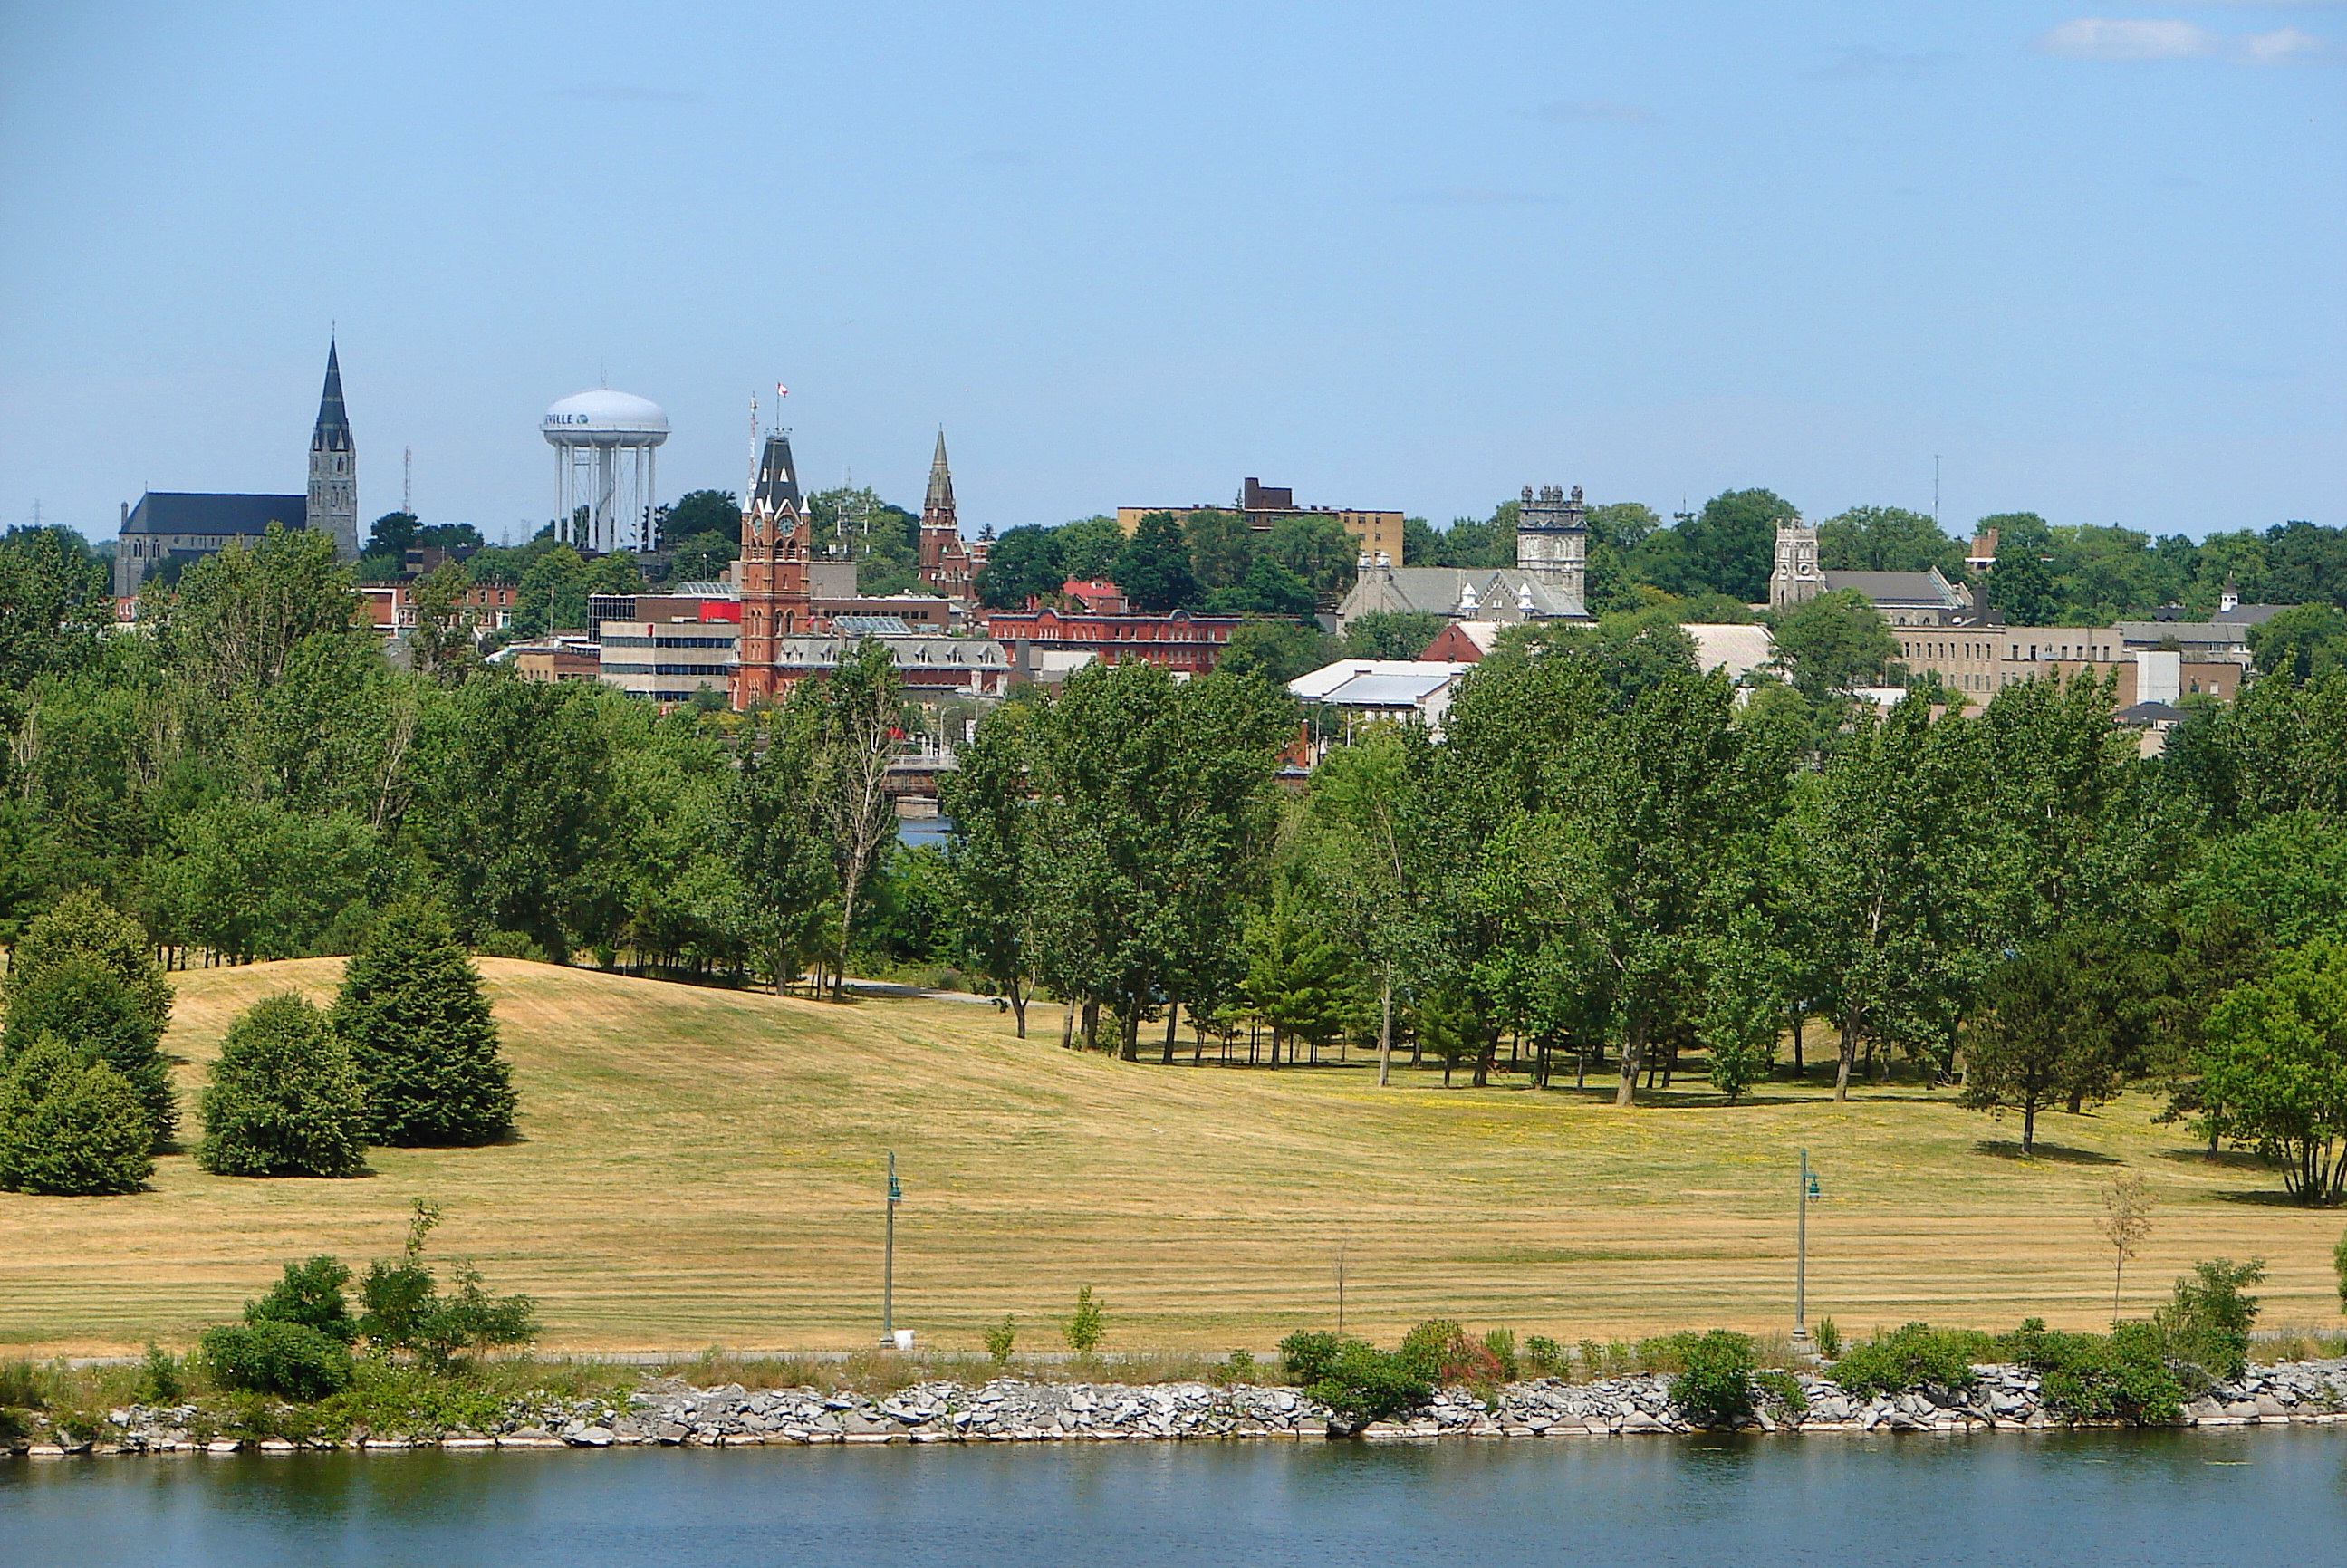
Burlington, Ontario
Wikimedia Commons via Wikipedia

Ontario

Burlington

OpenStats City Score, ranking history, and local readings for Burlington.

How Burlington scores

Burlington sits at City Score rank #11 with a standing of 63%, from 8 of 8 open-data pillars (tax, construction, connectivity, indoor air, water, seismic hazard, growth, safety). Missing pillars score at median standing so thin coverage cannot inflate the rank. The chart below shows how that standing moves year to year.

Latest owned placements: building permit value rank #28 of 172 (2025); indoor radon rank #85 of 117 at 85 Bq/m³ survey mean; residential mill rate rank #126 of 172 (9.05 mill rate). Full tables and method notes live on each study edition; atlas readings for the same slug open from the topic buttons.

#11
City Score rank
63%
City Score

Local readings for Burlington

Open each topic for Burlington.

See where Burlington water comes from

Local sports in Burlington

Documented pro, junior, university, and high-school teams tied to Burlington.

Hometown notes

Archive

Earlier years: 2026 · 2025 · 2024 · 2023

Burlington in brief

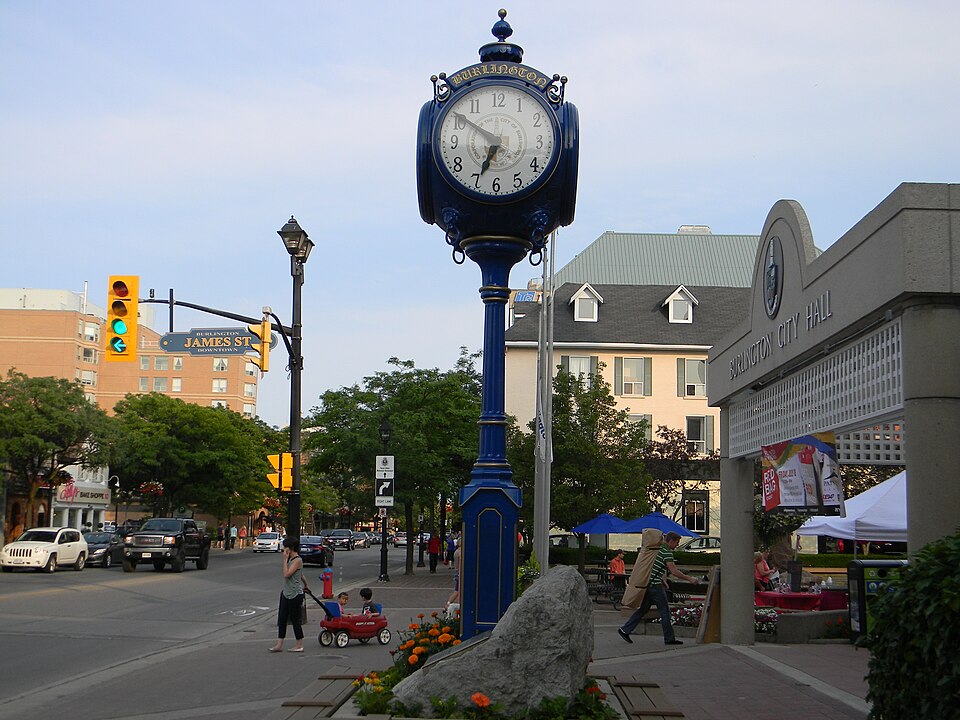
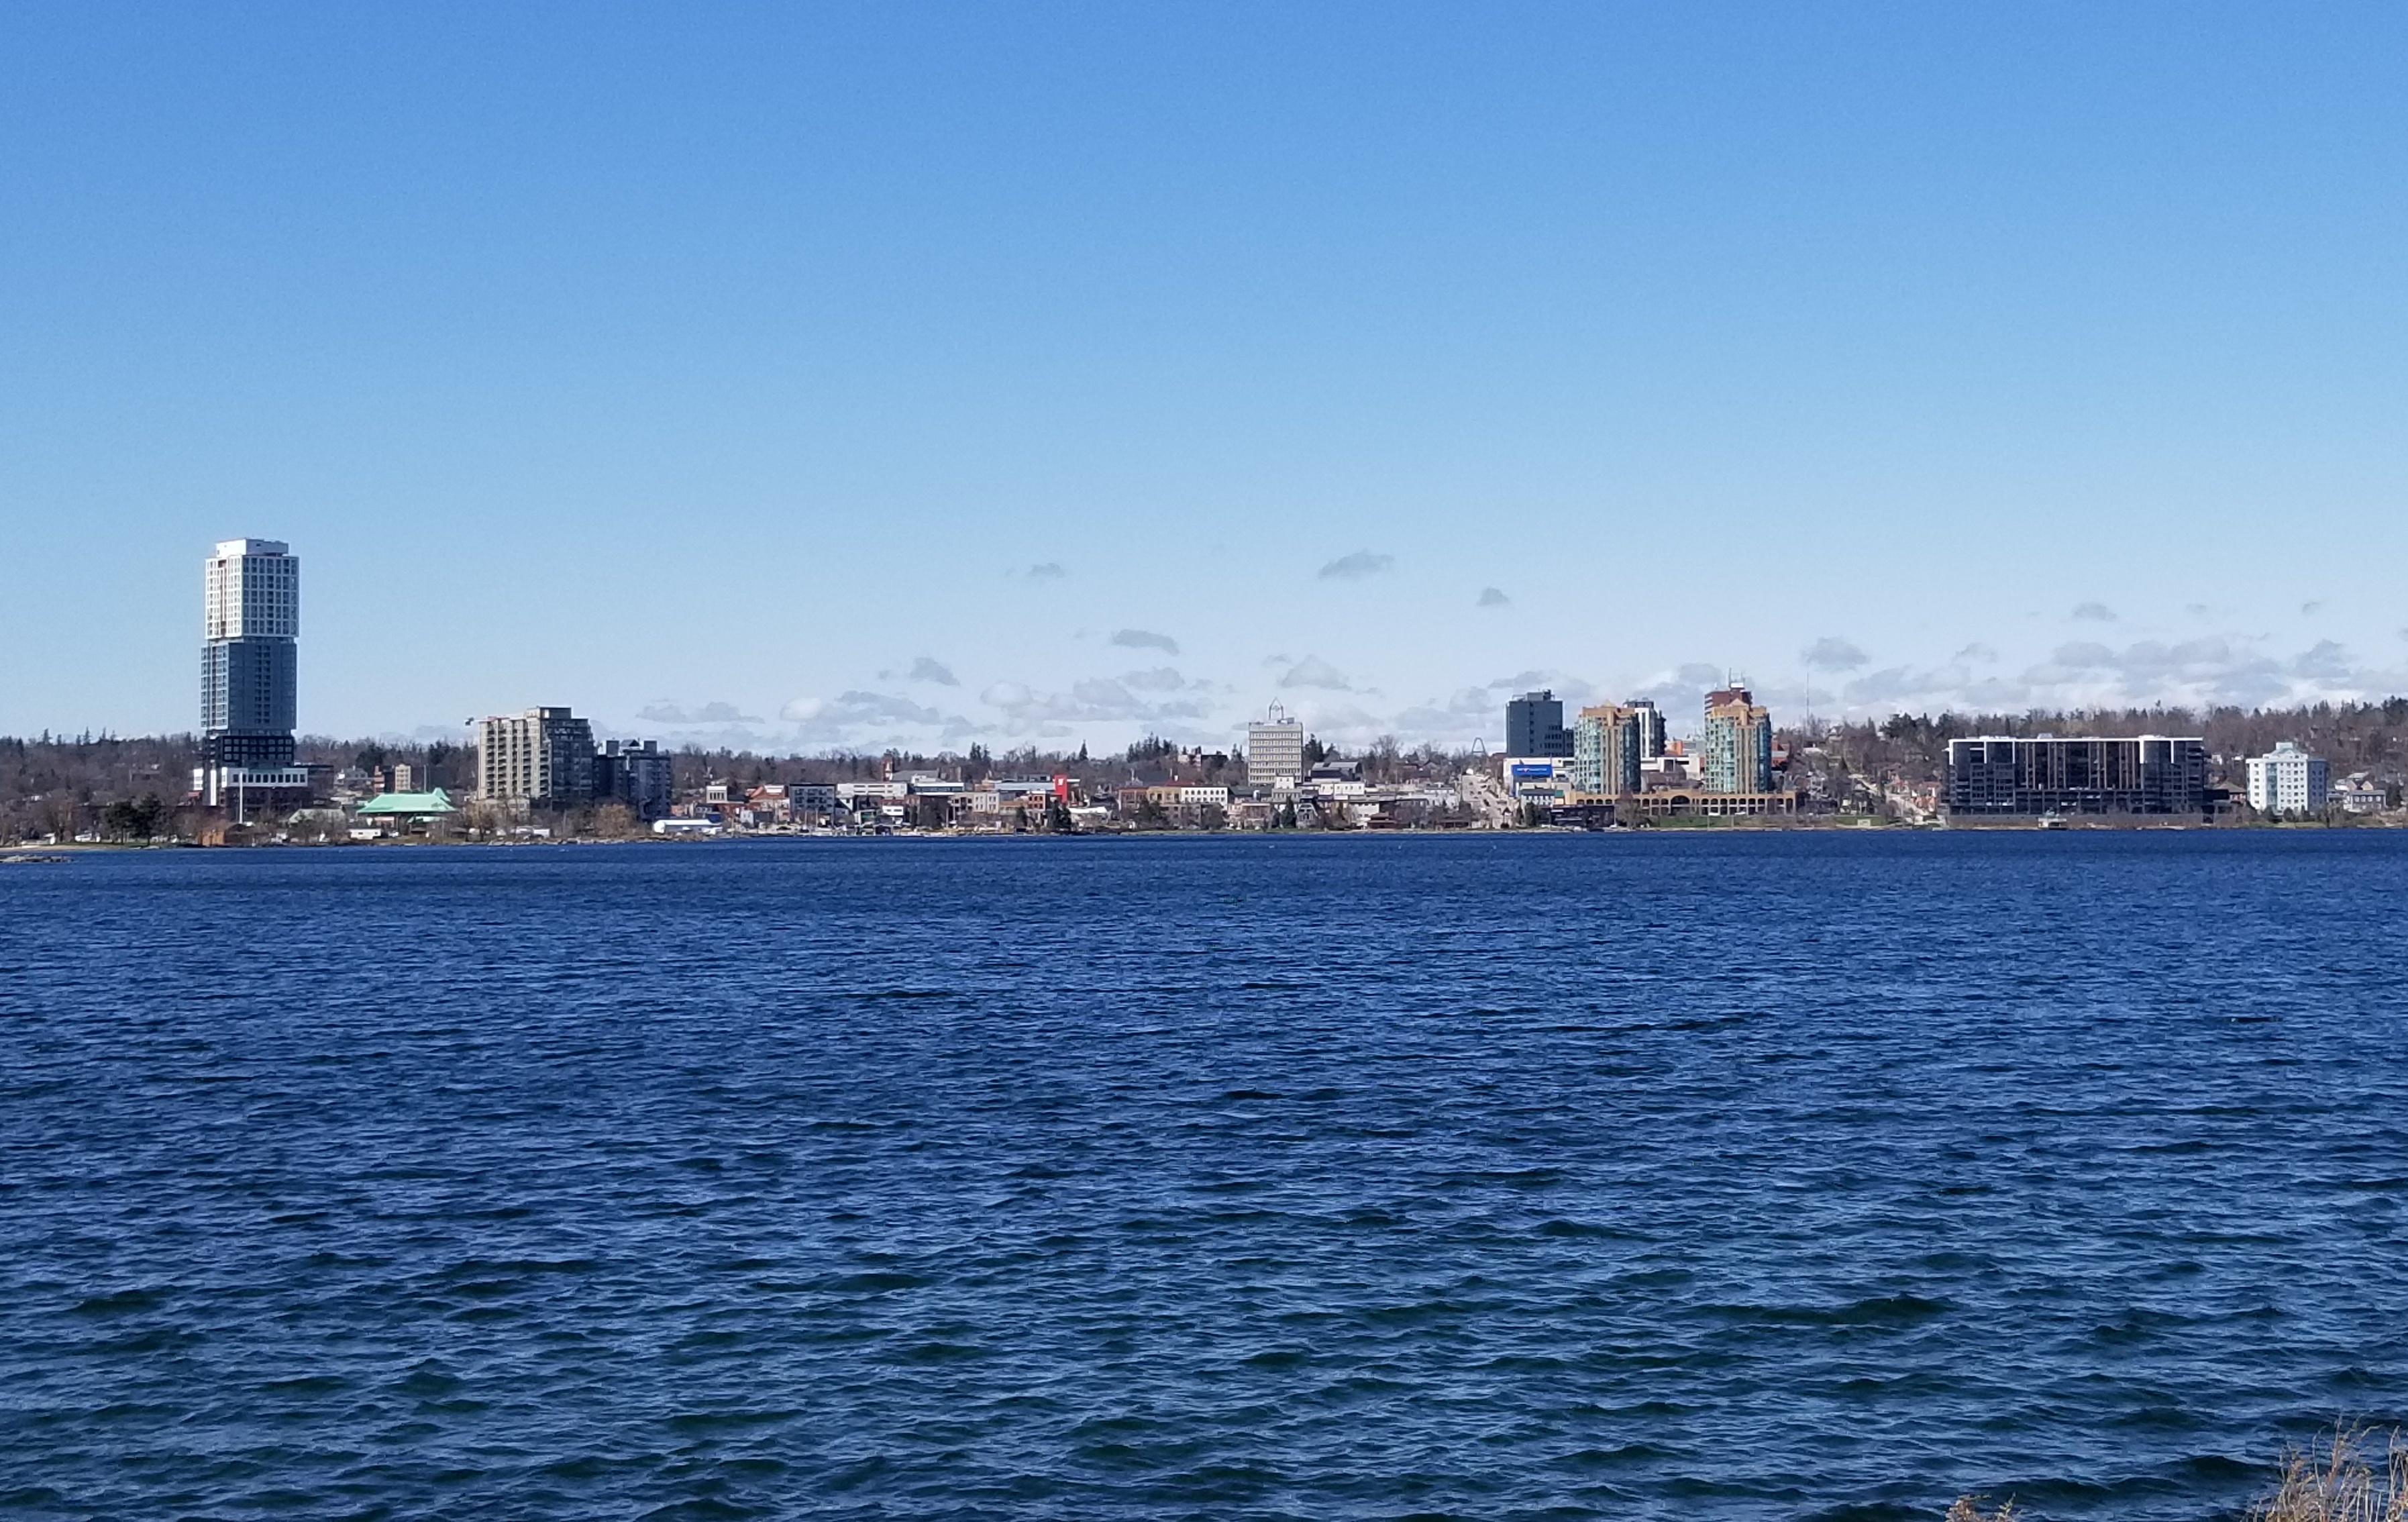
Burlington's downtown waterfront is a Lakeshore Road story first. Spencer Smith Park holds the promenade, festival lawn, Rotary Centennial Pond, and the view toward the Skyway Bridge. Brant Street Pier pushes 137 metres into Lake Ontario with a beacon people request by colour for civic causes; fog can flip it to lighthouse red without anyone filing a complaint form. Beachway Park keeps the sandy stretch and lakeside trails a short hop west at 1100 Lakeshore Road. Discovery Landing faces the water as the landmark building that also houses Spencer's on the Waterfront. Burlington Transit Routes 10 and 4 are the municipal directions printed for getting to Spencer Smith without circling for parking.

Arts stops sit in the same frame: Art Gallery of Burlington and Joseph Brant Museum share the City's downtown waterfront checklist. Inside Halton coverage keeps parks renewal, Jazz on the Plaza, and free summer gear in city parks on the local front, while Taste of Burlington runs as the winter prix-fixe dining festival under Discover Burlington. City notices still surface Ontario Land Tribunal files on Lakeshore Road development and budget talk on the municipal home. Waterfront Trail language shows up whenever walking or cycling along the lake is the point, and pier lighting requests have their own civic etiquette.

On the OpenStats City Score for 2026, Burlington sits at rank 22 of 125. Rankings aside, the hometown read is pier lights after supper, Beachway sand when the wind cooperates, and Spencer Smith as the place you name before you name a restaurant.

Drawn from Downtown Waterfront, Brant Street Pier, City of Burlington, Inside Halton, Taste of Burlington.

City Score over time

City Score from 2016–2025 across eight open-data pillars. Individual study placements are listed in the panels below.

0%25%50%75%100%2016201720182019202020212022202320242025
OpenStats City Score

Rankings for Burlington

Each study below is its own ranking. Where a study has more than one edition for this city, the chart shows standing across those years only.

Connectivity · OpenStats

OpenStats Broadband Download Speeds

OpenStats

Cities ranked by estimated best advertised download (Mbps). Anchored to the current ISED National Broadband Data vintage, then backcast along a national speed curve with city-specific fiber-arrival and 50/10 availability paths so relative ranks can change over the decade. Not a claim of audited historical hex maps for every year.

10 editions · 2016–2025

#7
Latest · 2025 · of 172
Score 61.8

Construction · OpenStats

OpenStats Building Permit Value

OpenStats

Cities ranked by calendar-year building permit value. Direct rows sum Statistics Canada Table 34-10-0292-01. Cities without a direct reading use population × provincial per-capita permit intensity (estimated), so every seed city has a year-varying construction signal.

10 editions · 2016–2025

#28
Latest · 2025 · of 172
Score 1150625692

Composite · OpenStats

OpenStats City Score

OpenStats

Dimensional average of OpenStats open-data pillars for each panel year 2016–2025: tax, construction, connectivity, indoor air, water, seismic hazard, population growth, and crime severity. Each series is scored 0–1 within its edition; series in the same pillar are averaged, then all eight pillars are averaged with equal weight. Missing pillars score at median standing (0.5). Growth and CSI use StatCan annual tables; permits, mill rates, and broadband use live rows plus documented year-varying estimates where needed. Radon, water, and PGA may be survey/model vintages carried forward and are flagged when static for more than two years. External commercial livability lists are never inputs.

10 editions · 2016–2025

#11
Latest · 2025 · of 172
Score 0.628

Safety · OpenStats

OpenStats Crime Severity Index

OpenStats

Communities ranked by Statistics Canada Crime Severity Index (Table 35-10-0026-01). Rank 1 is highest CSI (worse). Values are CMA where a metro match exists, otherwise provincial CSI. Hometown pages label the grain.

10 editions · 2016–2025

#152
Latest · 2025 · of 172
Score 54.82

Water · OpenStats

OpenStats Drinking Water Hardness

OpenStats

Communities ranked by municipal drinking-water hardness (mg/L as CaCO₃). Hardness changes slowly; the atlas vintage is carried across panel years and flagged when static for more than two years.

10 editions · 2016–2025

#42
Latest · 2025 · of 172
Score 210

Health · OpenStats

OpenStats Highest Indoor Radon

OpenStats

Communities ranked by Health Canada survey mean indoor radon (Bq/m³). Rank 1 is the highest mean. Decade panel years without a new survey carry the CMA survey vintage forward; they are not annual retests.

10 editions · 2016–2025

#85
Latest · 2025 · of 117
Score 84.9

sports · OpenStats

OpenStats Local Sports Depth

OpenStats

Cities ranked by weighted count of documented local teams (pro, junior, university, high-school hubs). Rank 1 = deepest documented sports footprint among covered seed cities. Not a claim about on-field success. See sports methodology for weights and gaps.

Single edition · 2025

#79
Published · 2025 · of 172
Score 3

Only one published edition places Burlington in this study so far. Open the edition for method notes and the full table.

Original source · Full edition

Growth · OpenStats

OpenStats Population Growth

OpenStats

Cities ranked by year-over-year population growth from Statistics Canada annual CSD estimates (Table 17-10-0155-01). Rank 1 is fastest growth. A few places without a clean CSD match use a provincial-path estimate anchored to seed population.

10 editions · 2016–2025

#164
Latest · 2025 · of 172
Score -0.006790932698441401

Property tax · OpenStats

OpenStats Residential Mill Rates

OpenStats

Municipalities ranked by residential mill rate. Rank 1 is the highest rate. Published municipal years are used when available; gaps are interpolated or follow the provincial median path so the tax pillar moves year to year for every city.

10 editions · 2016–2025

#126
Latest · 2025 · of 172
Score 9.05

Hazards · OpenStats

OpenStats Seismic Hazard (PGA)

OpenStats

Communities ranked by NRCan peak ground acceleration (higher = stronger shaking hazard). Rank 1 is highest PGA. The seismic model is multi-year; values are carried across the City Score panel and flagged as static until NRCan publishes a new generation.

10 editions · 2016–2025

#62
Latest · 2025 · of 172
Score 0.08

Livability

Globe and Mail Most Livable Cities

The Globe and Mail

2023 data partnership with Environics Analytics ranking 439 Canadian communities on ten livability categories.

Single edition · 2023

#5
Published · 2023 · of 439

Only one published edition places Burlington in this study so far. Open the edition for method notes and the full table.

Original source · Full edition

Livability

Maclean's Best Communities

Maclean's

Successor-style municipal livability ranking published by Maclean's for 2019 and 2021 (no 2020 edition).

Single edition · 2019

#1
Published · 2019 · of 415

Only one published edition places Burlington in this study so far. Open the edition for method notes and the full table.

Original source · Full edition

Worth knowing in Burlington

Distinctive local notes and places, each linked to its source.

  • Brant Street Pier extends 137 m into Lake Ontario from Spencer Smith Park and runs a nightly beacon lighting program for civic causes.

    City of Burlington

  • City waterfront pages list Beachway Park, Discovery Landing, Spencer Smith Park, and the pier as the four main downtown waterfront areas.

    City of Burlington

  • Rotary Centennial Pond at Spencer Smith Park is framed for winter skating and summer model sailboats.

    City of Burlington

  • Inside Halton local coverage regularly tracks Burlington parks programming, including Jazz on the Plaza.

    Inside Halton

Places to see

Brant Street Pier

The signature walk over Lake Ontario from Spencer Smith Park, open late and lit by request for community causes. Locals check the beacon colour the way other towns check a clock tower.

Spencer Smith Park

Downtown's waterfront living room for festivals, the pier, and Skyway Bridge views. If Burlington is meeting outside, the pin is usually here on Lakeshore Road.

Beachway Park

The sandy lakefront alternative with trails, pavilion, and seasonal concession. It is the beach day when Spencer Smith is reserved for a festival footprint.

Follow Burlington by email

When Burlington moves in a ranking, posts new permit figures, or lands in a study, get a short note. A few sends a year, only when something changes.

No spam. Unsubscribe with one reply.

Related guides

More places in Ontario

All Ontario cities