Campbellton, New Brunswick
Wikimedia Commons via Wikipedia

New Brunswick · Civic arena

Campbellton

Campbellton drinking water hardness is 106 mg/L on OpenStats, plus City Score rankings and local readings.

Civic arena · hometown HUD

Campbellton

Census_agglomeration13k pop
45XP
#252

#252 of 343

45% City Score XP

RisingSurface
City Score XP

5/8 pillars on the board

45%#252

Decade trail

Campbellton packs 5 of eight open-data pillars into its composite standing. Tap a rival below to see how the hometown stacks up head-to-head.

Campbellton drinking water

Regional estimate from nearest municipal sample

Hardness, pH, and lead from municipal reports on the OpenStats water atlas. This page uses a regional estimate — open the water atlas for method notes.

Hardness
106 mg/L
moderately hard
pH
7.9
Lead
0.2 μg/L

Full Campbellton water quality report →City Score rankingsCompare cities · vs Saint John · vs BathurstHardness guide

Watershed to tap · system map

How Campbellton's water works

Source, treatment, and distribution for Campbellton from municipal and provincial water records. Open the animated map for the full watershed-to-tap diagram — no nested topic navigation here.

Local numbers for Campbellton

Permits, tax, internet, radon, hazards, drinking water, and sports rankings where a CHL hometown applies.

Sports

Junior hockey in Campbellton

Full sports page →
Team
Campbellton Tigers
League
MHL
Points %
51.0%

51 GP · 52 pts · Compare CHL cities

How Campbellton scores

Rising+67

Campbellton sits at City Score rank #252 with a standing of 45%, from 5 of 8 open-data pillars (tax, construction, connectivity, indoor air, water, seismic hazard, growth, safety). Missing pillars score at median standing so thin coverage cannot inflate the rank. Rising 67 places versus 2022 (#319 → #252).

Latest owned placements: indoor radon rank #12 of 327 at 197 Bq/m³ survey mean. Full tables and method notes live on each study edition; atlas readings for the same slug open from the topic buttons.

In the 2025 City Score edition, Campbellton carries a City Score standing of 45% (rank #252 of 343) with 5 of 8 pillars observed. That sits 3 points below the New Brunswick peer average across 16 ranked cities. Within New Brunswick, Campbellton ranks #12 of 16 on City Score.

The strongest signal in the current chart is drinking-water hardness (standing 85%, rank #292 of 343, raw score 106). The weakest observed pillar is indoor radon (standing 4%, rank #12 of 327).

Drinking-water hardness on the water atlas reads 106 mg/L as CaCO₃ for Campbellton. Compare that figure to the hardness pillar on the chart and to the national hardness guide on the hub.
#252
Arena rank (of 343)
45%
City Score
5
Pillars observed
Rising+67
vs 2022
#319 → #252

Arena loadout

Topic XP bars

Arena rank #252 of 343

City Score

5/8 pillars · main XP bar

45%#252
Drinking water

Pillar avg · hardness #292

76%
Building permits

No placement

—
Internet

Rank #206

40%
Radon

Rank #12

4%
Hazards

Rank #92

27%
Property tax

No placement

—

Campbellton pillar standing

Eight equal-weight City Score pillars, 2025 panel year.

TaxPermitsNetRadonWaterHazardsGrowthCrime

Source: OpenStats composite / study editions

City Score standing trend

Standing percentage by panel year (higher is better).

Years: 2016, 2017, 2018, 2019, 2020, 2021, 2022, 2023, 2024, 2025

Source: OpenStats composite timeseries

Achievements

Rising +67Surface water supply

Hometown notes

City profile

Older hometown notes stay on the desk archive (noindex) — this section shows recent highlights only.

Campbellton in brief

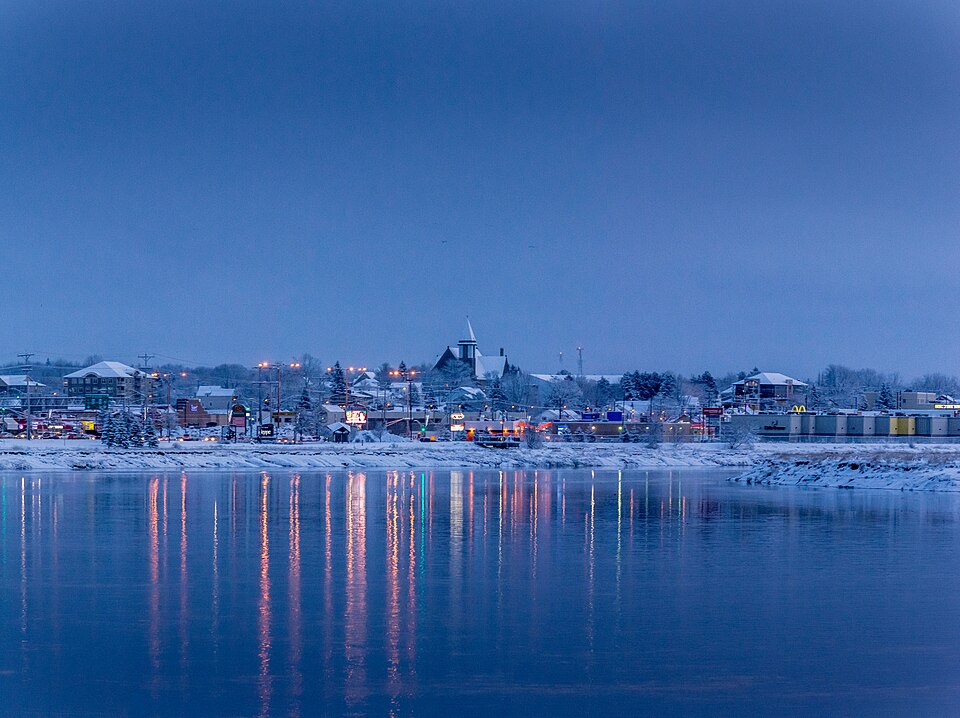
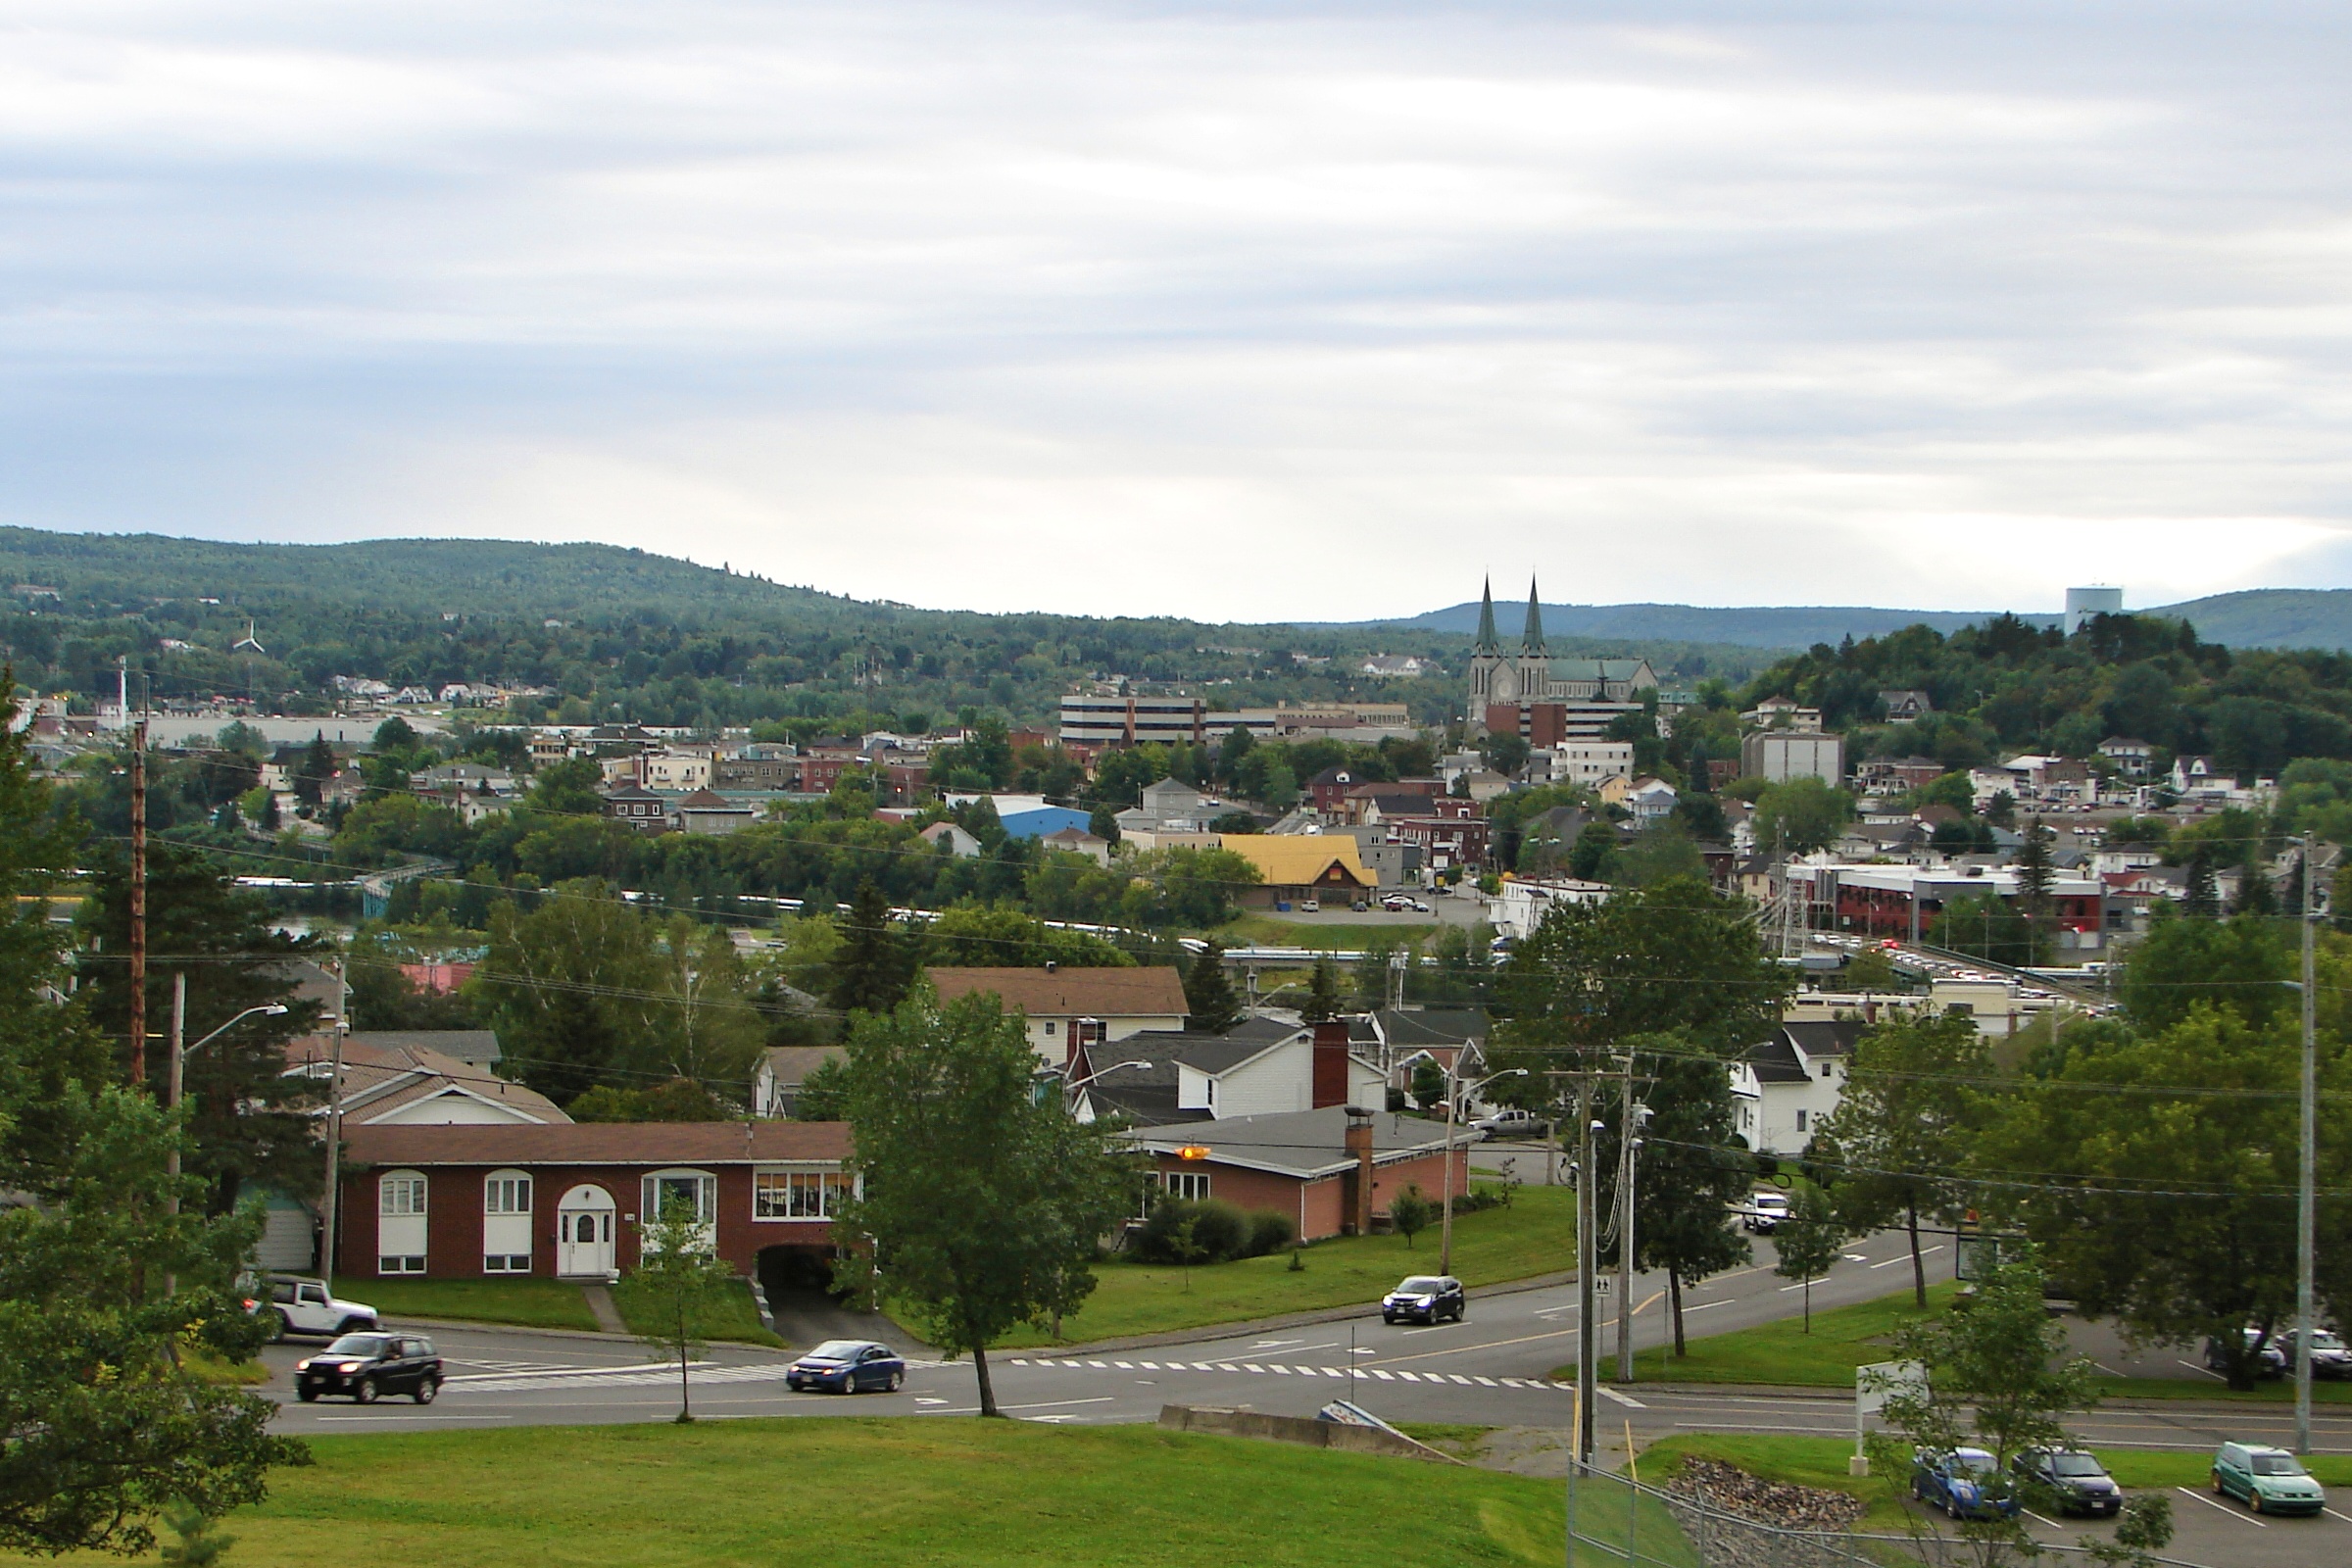
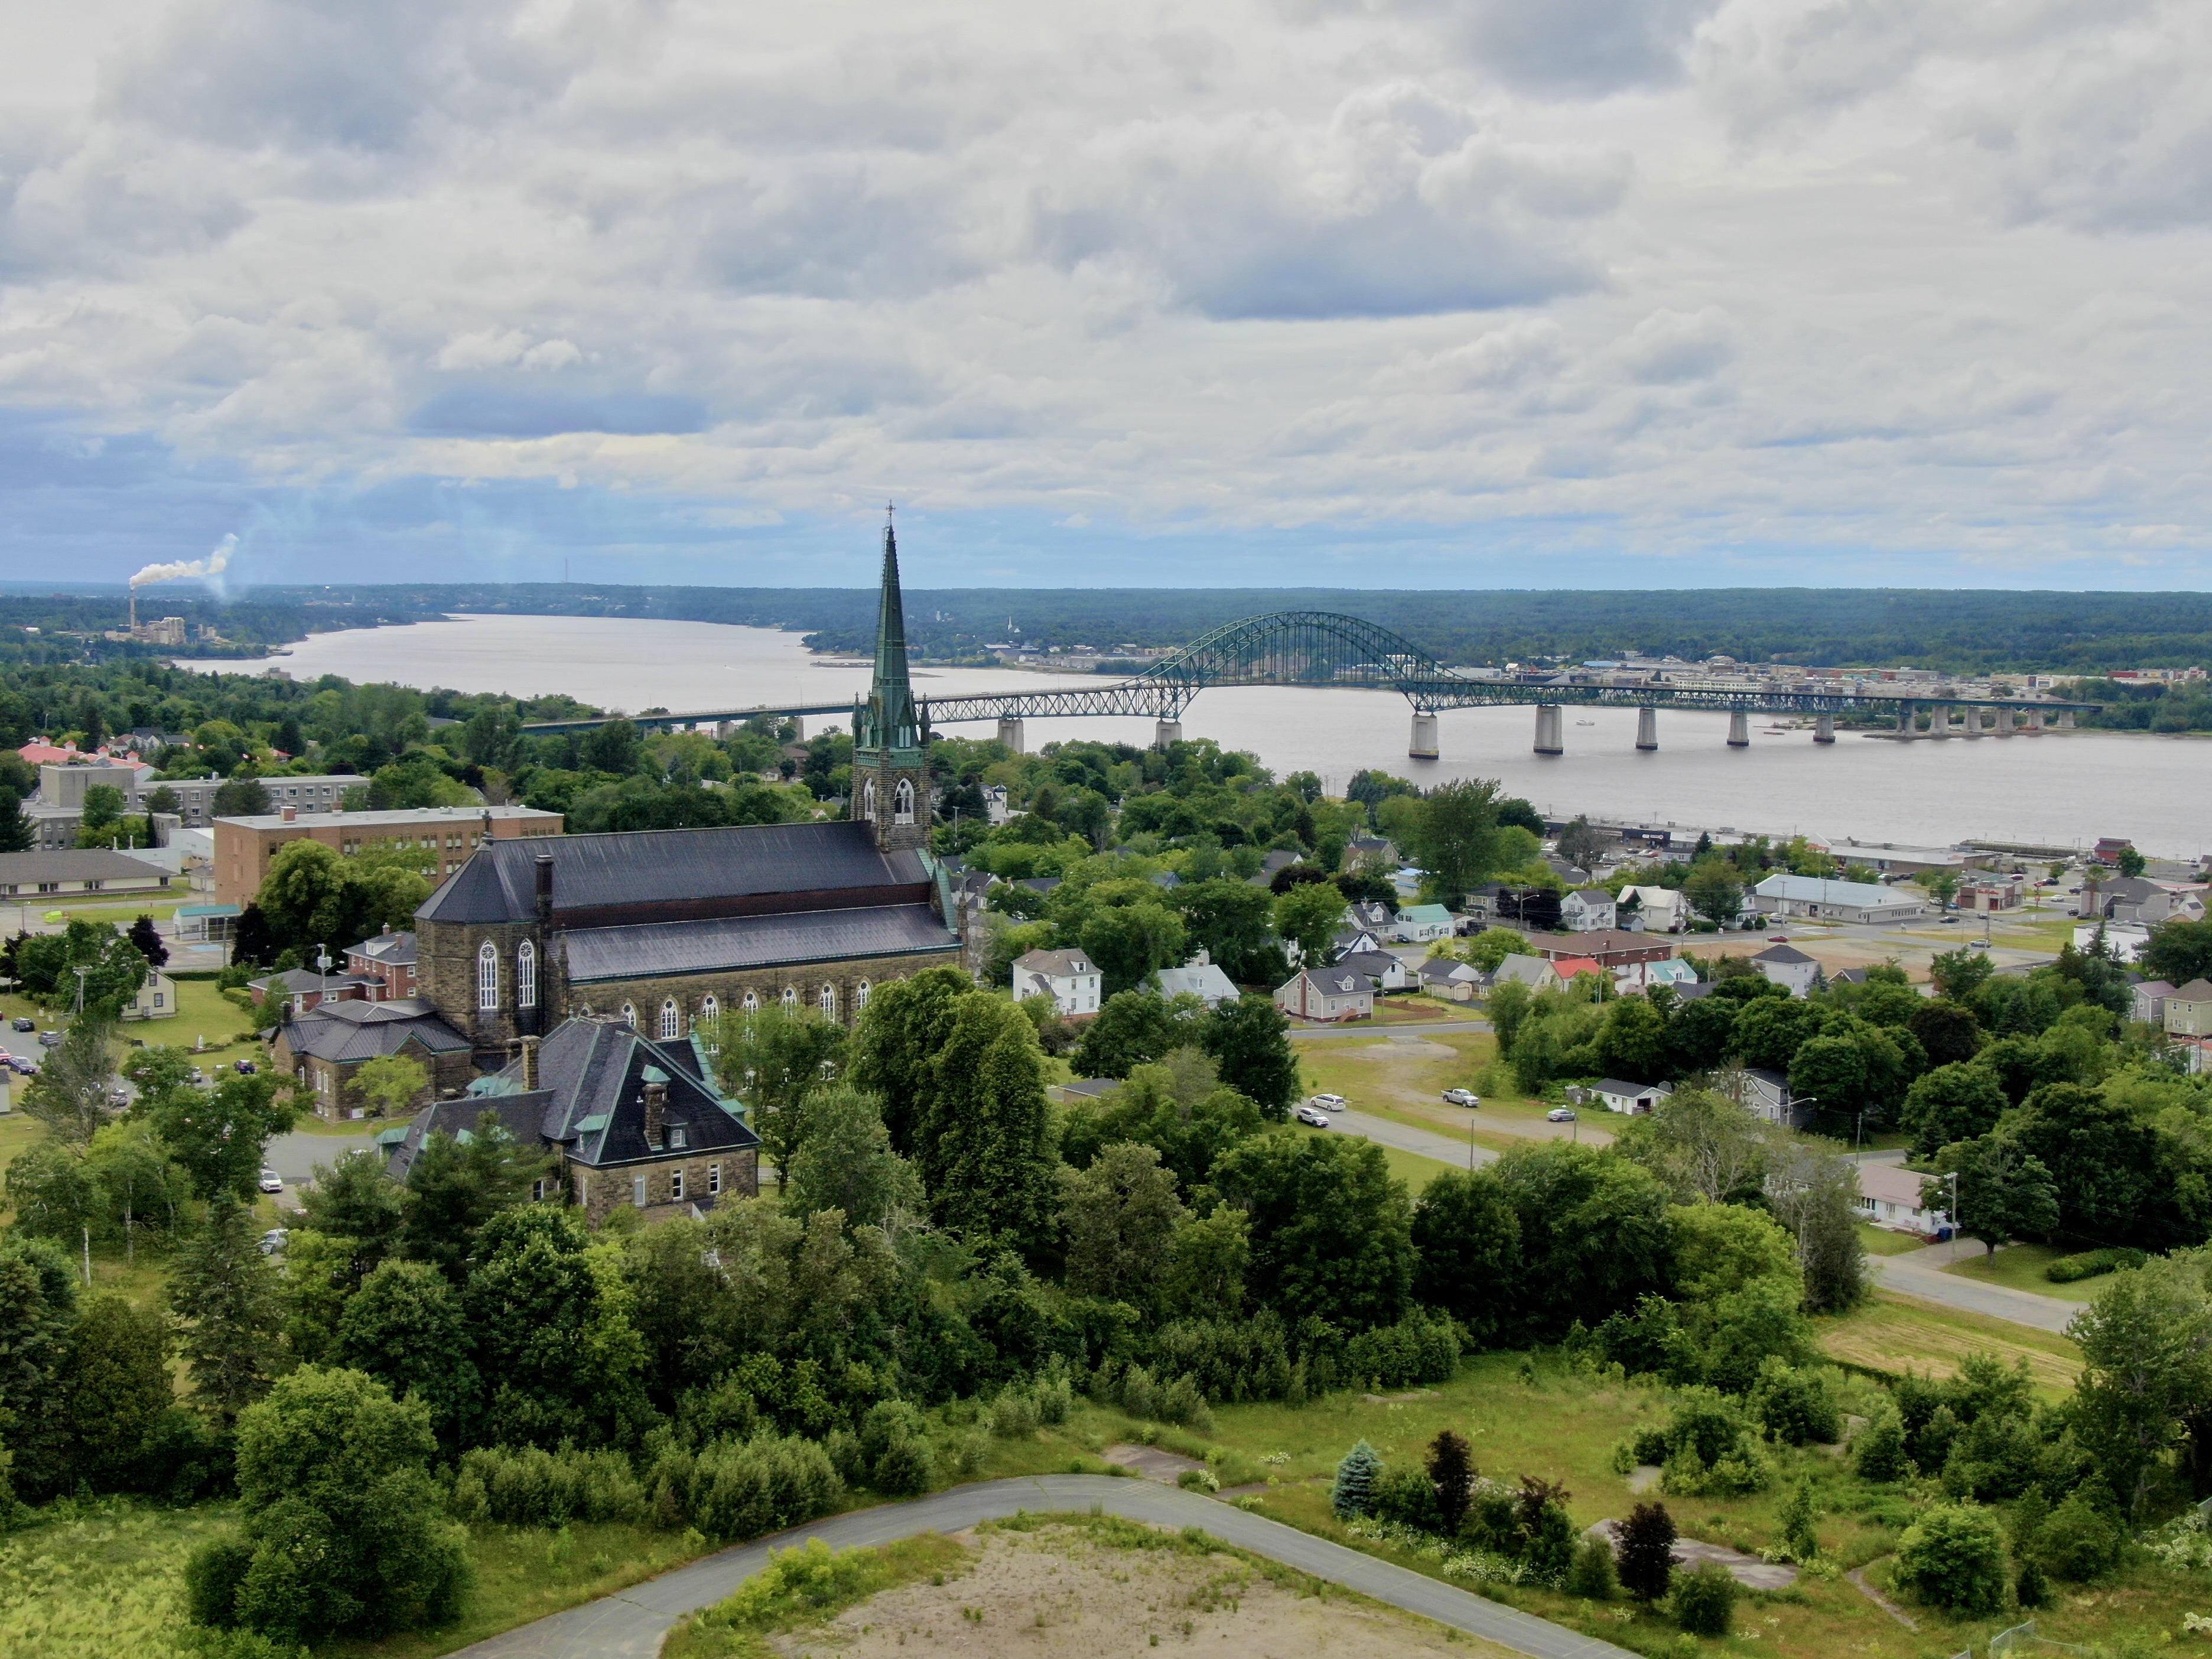
Campbellton now answers to Campbellton Regional Community, and that name is not stationery fluff. The municipality folds in the former towns of Atholville and Tide Head plus McLeods and Glencoe, then maps council work across Areas: Tide Head to Glencoe, Atholville to St-Arthur, Val D'Amours, and Campbellton to McLeods. City Hall still sits on Water Street, while the Memorial Regional Civic Centre is where the new council took its oath. People here still say Campbellton in conversation; the regional label is how the paperwork keeps the sectors in one room.

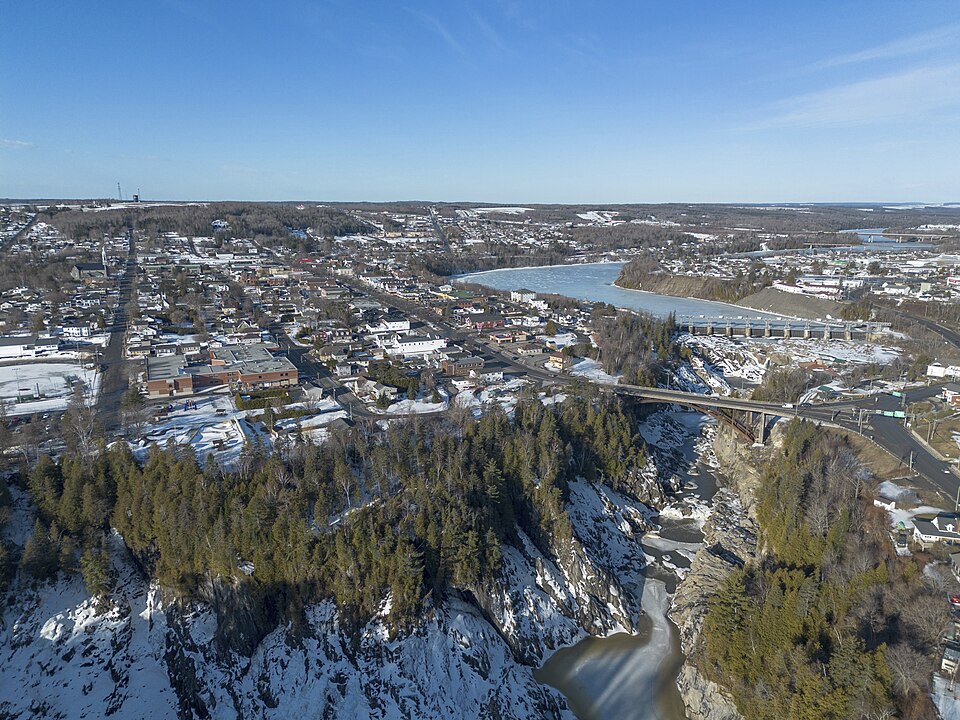
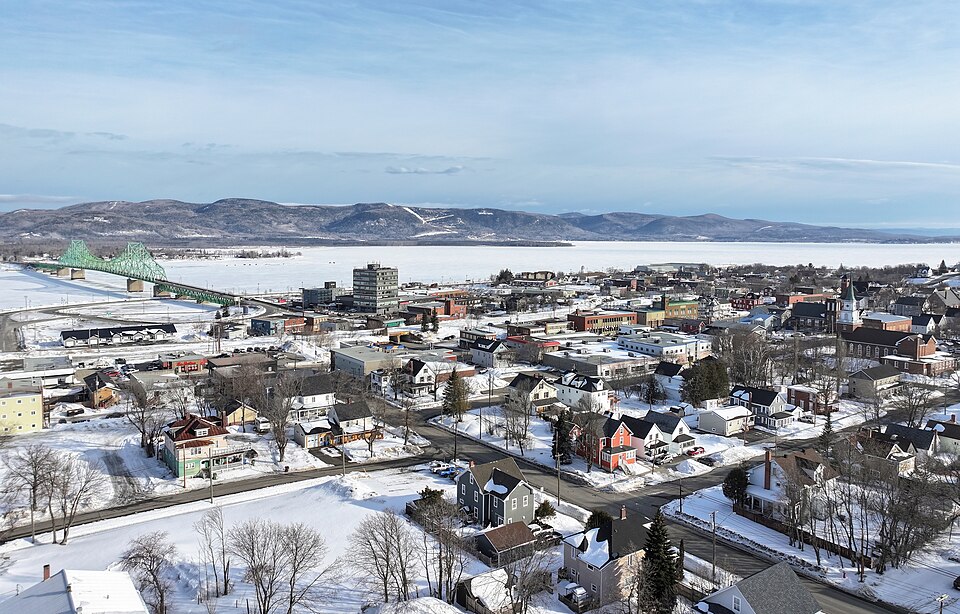
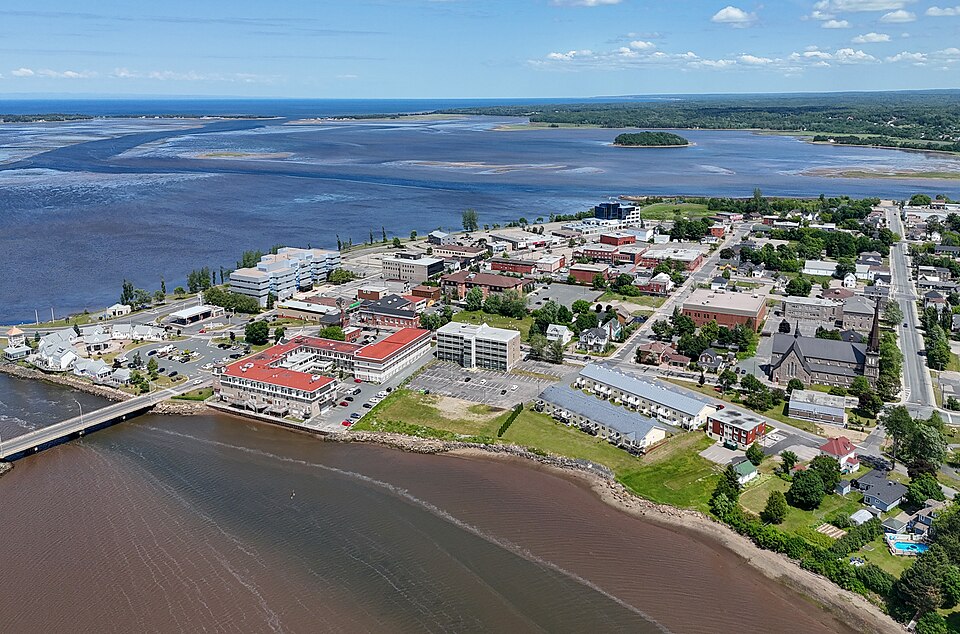
Geography stays blunt in the municipal about line: Chaleur Bay at the mouth of the Restigouche River, north tip of New Brunswick, Restigouche County. That river-and-bay framing is what separates Campbellton from inland mill towns and from Bathurst farther down the same bay. Notre Dame St. has been the named corridor for water and sewer work tied to housing funding, the sort of street project that shows up when apartments and hydrants share a press release. Housing Accelerator talk and CHIF infrastructure dollars are the current civic growth file.

Culture leans Acadian without needing a tourist brochure. Les Éloizes, the Atlantic Acadian arts awards, are booked for Campbellton in May 2026, a hosting win the Regional Community announced with open pride. Everyday landmarks stay practical: Salle de quilles Gerard Bertin and Alma Hall on the municipal menu, Campbellton Regional Hospital as the health-care name locals already know, Polyvalente Roland-Pépin as the school shorthand in community bios. Campbellton is Restigouche-mouth geography, sector politics after reform, and an Éloizes year on the calendar.

Drawn from Campbellton Regional Community, Campbellton publications, Campbellton contact.

City Score over time

City Score from 2016–2025 across eight open-data pillars. Individual study placements are listed in the panels below.

0%25%50%75%100%2016201720182019202020212022202320242025
OpenStats City Score

Rankings for Campbellton

Each study below is its own ranking. Where a study has more than one edition for this city, the chart shows standing across those years only.

Safety · OpenStats

Crime severity not placed

Statistics Canada does not publish a police-service Crime Severity Index that OpenStats can match to Campbellton without copying a province, CMA, or another city. The safety pillar scores at median standing (50%) on City Score, the same rule used for other missing pillars.

Connectivity · OpenStats

OpenStats Broadband Download Speeds

OpenStats

Cities ranked by household-weighted maximum advertised download (Mbps) from ISED National Broadband Data hex ISP rows, with hex-to-city assignment by population-weighted gravity. The headline 2025 score is the dwelling-weighted mean of per-hex technology ceilings (fibre and cable at 1 Gbps, DSL lower). Household-weighted 50/10 availability (%) is stored on atlas rows as avail_5010_pct. Earlier panel years backcast along a national speed curve with city-specific fiber and availability paths.

10 editions · 2016–2025

#206
Latest · 2025 · of 343
Score 348.3

Composite · OpenStats

OpenStats City Score

OpenStats

Dimensional average of OpenStats open-data pillars for each panel year 2016-2025: tax, construction, connectivity, indoor air, water, seismic hazard, population growth, and crime severity. Each series is scored 0-1 within its edition; series in the same pillar are averaged, then all eight pillars are averaged with equal weight. Missing pillars score at median standing (0.5). Crime severity uses StatCan police-service CSI only (Tables 35-10-0026-01 and 35-10-0063-01); cities without a police-service match take median standing on the safety pillar. Growth uses StatCan CSD estimates; construction uses verified municipal building-permit value per resident (population field on each city record, 2021 Census vintage); mill rates and broadband use live rows plus documented year-varying estimates where needed. Radon, water, and PGA may be survey/model vintages carried forward and are flagged when static for more than two years. External commercial livability lists are never inputs.

10 editions · 2016–2025

#252
Latest · 2025 · of 343
Score 0.451

Water · OpenStats

OpenStats Drinking Water Hardness

OpenStats

Communities ranked by municipal drinking-water hardness (mg/L as CaCO₃). Hardness changes slowly; the atlas vintage is carried across panel years and flagged when static for more than two years.

10 editions · 2016–2025

#292
Latest · 2025 · of 343
Score 106

Health · OpenStats

OpenStats Highest Indoor Radon

OpenStats

Communities ranked by Health Canada survey mean indoor radon (Bq/m³). Rank 1 is the highest mean. Decade panel years without a new survey carry the CMA survey vintage forward; they are not annual retests.

10 editions · 2016–2025

#12
Latest · 2025 · of 327
Score 196.5

Sports · OpenStats

OpenStats Local Sports Depth

OpenStats

Hometowns with a mapped junior hockey franchise ranked by local sports depth: league tier (CHL member leagues = 1.0, MHL = 0.65) multiplied by regular-season points percentage. Surfaces cities with both a franchise and a strong standings year; not a City Score pillar input.

Single edition · 2025

#48
Published · 2025 · of 49
Score 0.332

Only one published edition places Campbellton in this study so far. Open the edition for method notes and the full table.

Original source · Full edition

Sports · OpenStats

OpenStats Maritime Hockey League Points Percentage

OpenStats

Maritime Hockey League (MHL) member cities ranked by regular-season points percentage. Smaller Atlantic league; only cities with a mapped MHL franchise appear.

Single edition · 2026

#3
Published · 2026 · of 4
Score 0.51

Only one published edition places Campbellton in this study so far. Open the edition for method notes and the full table.

Original source · Full edition

Growth · OpenStats

OpenStats Population Growth

OpenStats

Cities ranked by year-over-year population growth from Statistics Canada annual CSD estimates (Table 17-10-0155-01). Rank 1 is fastest growth. A few places without a clean CSD match use a provincial-path estimate anchored to seed population.

10 editions · 2016–2025

#124
Latest · 2025 · of 343
Score 0.015603799185888738

Hazards · OpenStats

OpenStats Seismic Hazard (PGA)

OpenStats

Communities ranked by NRCan peak ground acceleration (higher = stronger shaking hazard). Rank 1 is highest PGA. The seismic model is multi-year; values are carried across the City Score panel and flagged as static until NRCan publishes a new generation.

10 editions · 2016–2025

#92
Latest · 2025 · of 343
Score 0.088

Livability

MoneySense Best Places to Live

MoneySense

Annual composite ranking of Canadian municipalities on economy, housing, crime, health, and weather.

Single edition · 2015

#201
Published · 2015 · of 209

Only one published edition places Campbellton in this study so far. Open the edition for method notes and the full table.

Original source · Full edition

Worth knowing in Campbellton

Distinctive local notes and places, each linked to its source.

Places to see

Memorial Regional Civic Centre

Civic venue used for the regional council swearing-in. It is the indoor landmark named when the municipality marks formal moments.

Water Street City Hall

Municipal contact address puts City Hall on Water Street. It is the practical downtown pin for permits, payments, and council business.

Follow Campbellton by email

When Campbellton moves in a ranking, posts new permit figures, or lands in a study, get a short note. A few sends a year, only when something changes.

No spam. Unsubscribe with one reply.

Related guides

More places in New Brunswick

All New Brunswick cities