Vernon, British Columbia
Wikimedia Commons via Wikipedia

British Columbia

Vernon

OpenStats City Score, ranking history, and local readings for Vernon.

Dropping13

City Score #69 (2022) → #82 (2025)

How Vernon scores

Dropping13

Vernon sits at City Score rank #82 with a standing of 50%, from 8 of 8 open-data pillars (tax, construction, connectivity, indoor air, water, seismic hazard, growth, safety). Missing pillars score at median standing so thin coverage cannot inflate the rank. Dropping 13 places versus 2022 (#69 → #82).

Latest owned placements: building permit value rank #58 of 172 (2025); indoor radon rank #25 of 117 at 135 Bq/m³ survey mean; residential mill rate rank #92 of 172 (10.51 mill rate). Full tables and method notes live on each study edition; atlas readings for the same slug open from the topic buttons.

#82
City Score rank
50%
City Score
Dropping13
vs 2022
#69 → #82

Local readings for Vernon

Open each topic for Vernon.

See where Vernon water comes from

Local sports in Vernon

Documented pro, junior, university, and high-school teams tied to Vernon.

Hometown notes

Archive

Earlier years: 2026 · 2025 · 2024 · 2023

Vernon in brief

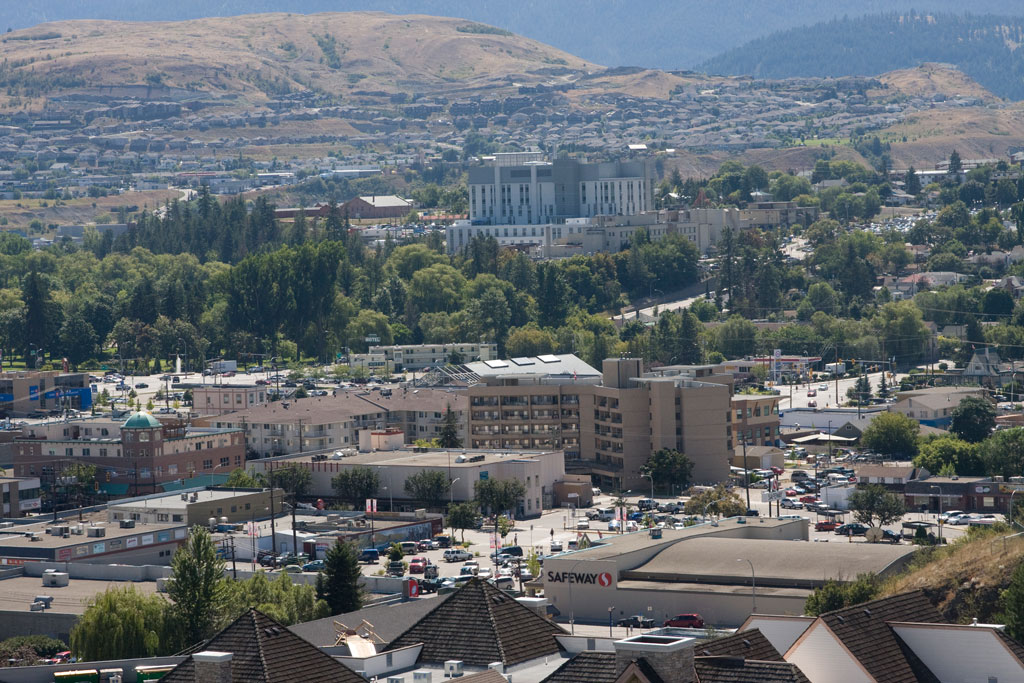
Vernon orients around water more than a single downtown square. On the municipal parks list, Kal Beach is the short form for Kalamalka Lake swimming, with Kin Beach and Paddlewheel Park holding the Okanagan Lake side along Tronson Road and Okanagan Landing Road. Polson Park keeps a central sports and skateboard footprint on Highway 6. Above the grid, the Grey Canal Trail stitches hillside walking segments that locals treat as everyday infrastructure, not a one-weekend hike.

Kal Tire Place is the arena name that doubles as an emergency address when fire season turns serious. City pages have put Emergency Support Services there during the Bradley Creek wildfire, while Greater Vernon Water Stage 3 restrictions remind everyone that a dry July is a civic file, not just a garden complaint. The Morning Star still brands the beat North Okanagan, so Commonage Road grass fires and Silver Star mountain events travel on the same local desk as city notices.

Okanagan Indian Band links sit on the city homepage for a reason: regional emergency talk and community coverage keep crossing municipal lines. BX Falls adds a named hike when the beaches feel crowded, and Polson Park remains the easy central meetup when someone just wants shade and a playground. On the OpenStats City Score for 2026, Vernon sits at rank 108 of 125. The hometown read is simpler: Kal Beach shorthand, two lake shores, Grey Canal paths, and a rec barn that becomes an ESS centre when the hills burn.

Drawn from City of Vernon parks, City of Vernon, Vernon Morning Star.

City Score over time

City Score from 2016–2025 across eight open-data pillars. Individual study placements are listed in the panels below.

0%25%50%75%100%2016201720182019202020212022202320242025
OpenStats City Score

Rankings for Vernon

Each study below is its own ranking. Where a study has more than one edition for this city, the chart shows standing across those years only.

sports · OpenStats

OpenStats BCHL Points Percentage

OpenStats

Cities with a British Columbia Hockey League club in the OpenStats seed list ranked by regular-season points percentage. Rank 1 = highest points %. Source: Wikipedia BCHL season standings. Clubs in towns outside the seed list are omitted.

Single edition · 2025

#15
Published · 2025 · of 16
Score 0.333

Only one published edition places Vernon in this study so far. Open the edition for method notes and the full table.

Original source · Full edition

Connectivity · OpenStats

OpenStats Broadband Download Speeds

OpenStats

Cities ranked by estimated best advertised download (Mbps). Anchored to the current ISED National Broadband Data vintage, then backcast along a national speed curve with city-specific fiber-arrival and 50/10 availability paths so relative ranks can change over the decade. Not a claim of audited historical hex maps for every year.

10 editions · 2016–2025

#63
Latest · 2025 · of 172
Score 41.5

Construction · OpenStats

OpenStats Building Permit Value

OpenStats

Cities ranked by calendar-year building permit value. Direct rows sum Statistics Canada Table 34-10-0292-01. Cities without a direct reading use population × provincial per-capita permit intensity (estimated), so every seed city has a year-varying construction signal.

10 editions · 2016–2025

#58
Latest · 2025 · of 172
Score 446625004

Composite · OpenStats

OpenStats City Score

OpenStats

Dimensional average of OpenStats open-data pillars for each panel year 2016–2025: tax, construction, connectivity, indoor air, water, seismic hazard, population growth, and crime severity. Each series is scored 0–1 within its edition; series in the same pillar are averaged, then all eight pillars are averaged with equal weight. Missing pillars score at median standing (0.5). Growth and CSI use StatCan annual tables; permits, mill rates, and broadband use live rows plus documented year-varying estimates where needed. Radon, water, and PGA may be survey/model vintages carried forward and are flagged when static for more than two years. External commercial livability lists are never inputs.

10 editions · 2016–2025

#82
Latest · 2025 · of 172
Score 0.505

Safety · OpenStats

OpenStats Crime Severity Index

OpenStats

Communities ranked by Statistics Canada Crime Severity Index (Table 35-10-0026-01). Rank 1 is highest CSI (worse). Values are CMA where a metro match exists, otherwise provincial CSI. Hometown pages label the grain.

10 editions · 2016–2025

#25
Latest · 2025 · of 172
Score 103.68

Water · OpenStats

OpenStats Drinking Water Hardness

OpenStats

Communities ranked by municipal drinking-water hardness (mg/L as CaCO₃). Hardness changes slowly; the atlas vintage is carried across panel years and flagged when static for more than two years.

10 editions · 2016–2025

#105
Latest · 2025 · of 172
Score 148

Health · OpenStats

OpenStats Highest Indoor Radon

OpenStats

Communities ranked by Health Canada survey mean indoor radon (Bq/m³). Rank 1 is the highest mean. Decade panel years without a new survey carry the CMA survey vintage forward; they are not annual retests.

10 editions · 2016–2025

#25
Latest · 2025 · of 117
Score 135.3

sports · OpenStats

OpenStats Local Sports Depth

OpenStats

Cities ranked by weighted count of documented local teams (pro, junior, university, high-school hubs). Rank 1 = deepest documented sports footprint among covered seed cities. Not a claim about on-field success. See sports methodology for weights and gaps.

Single edition · 2025

#119
Published · 2025 · of 172
Score 3

Only one published edition places Vernon in this study so far. Open the edition for method notes and the full table.

Original source · Full edition

Growth · OpenStats

OpenStats Population Growth

OpenStats

Cities ranked by year-over-year population growth from Statistics Canada annual CSD estimates (Table 17-10-0155-01). Rank 1 is fastest growth. A few places without a clean CSD match use a provincial-path estimate anchored to seed population.

10 editions · 2016–2025

#77
Latest · 2025 · of 172
Score 0.01240801308258381

Property tax · OpenStats

OpenStats Residential Mill Rates

OpenStats

Municipalities ranked by residential mill rate. Rank 1 is the highest rate. Published municipal years are used when available; gaps are interpolated or follow the provincial median path so the tax pillar moves year to year for every city.

10 editions · 2016–2025

#92
Latest · 2025 · of 172
Score 10.50538417008702

Hazards · OpenStats

OpenStats Seismic Hazard (PGA)

OpenStats

Communities ranked by NRCan peak ground acceleration (higher = stronger shaking hazard). Rank 1 is highest PGA. The seismic model is multi-year; values are carried across the City Score panel and flagged as static until NRCan publishes a new generation.

10 editions · 2016–2025

#130
Latest · 2025 · of 172
Score 0.035

Livability

Maclean's Best Communities

Maclean's

Successor-style municipal livability ranking published by Maclean's for 2019 and 2021 (no 2020 edition).

Single edition · 2021

#30
Published · 2021 · of 415

Only one published edition places Vernon in this study so far. Open the edition for method notes and the full table.

Original source · Full edition

Worth knowing in Vernon

Distinctive local notes and places, each linked to its source.

  • Paddlewheel Park sits on the Vernon arm of Okanagan Lake with a beach, boat launch, and playground cluster.

    City of Vernon

  • Grey Canal Trail appears as a multi-segment walking network across Bella Vista, Coldstream Estates, East Vernon, and Silver Star foothills.

    City of Vernon

  • Kal Tire Place has served as an ESS reception centre during Bradley Creek wildfire response.

    City of Vernon

  • Greater Vernon Water Stage 3 restrictions are posted as a standing summer civic notice on the city homepage.

    City of Vernon

Places to see

Kal Beach

The Kalamalka Lake swim beach locals name in three letters. Volleyball courts and washrooms make it the default hot-day destination on the municipal list.

Paddlewheel Park

Okanagan Landing park with beach, boat launch, and play amenities on the Vernon arm of Okanagan Lake. It is the lake-day counterweight to Kal Beach.

Grey Canal Trail

Hillside walking network that reuses canal corridors across several Vernon neighbourhoods. Dog-walkers and after-dinner hikers treat the segments as local streets with better views.

BX Falls

Named hike on Tillicum Road in the city parks inventory. It is the waterfall outing when the beaches are full and you still want a Vernon address.

Follow Vernon by email

When Vernon moves in a ranking, posts new permit figures, or lands in a study, get a short note. A few sends a year, only when something changes.

No spam. Unsubscribe with one reply.

Related guides

More places in British Columbia

All British Columbia cities