Ontario

St. Catharines

OpenStats City Score, ranking history, and local readings for St. Catharines.

Rising+12

City Score #22 (2022) → #10 (2025)

How St. Catharines scores

Rising+12

St. Catharines sits at City Score rank #10 with a standing of 63%, from 8 of 8 open-data pillars (tax, construction, connectivity, indoor air, water, seismic hazard, growth, safety). Missing pillars score at median standing so thin coverage cannot inflate the rank. Rising 12 places versus 2022 (#22 → #10).

Latest owned placements: building permit value rank #12 of 172 (2025); indoor radon rank #101 of 117 at 57 Bq/m³ survey mean; residential mill rate rank #42 of 172 (13.23 mill rate). Full tables and method notes live on each study edition; atlas readings for the same slug open from the topic buttons.

#10
City Score rank
63%
City Score
Rising+12
vs 2022
#22 → #10

Local readings for St. Catharines

Open each topic for St. Catharines.

See where St. Catharines water comes from

Local sports in St. Catharines

Documented pro, junior, university, and high-school teams tied to St. Catharines.

Hometown notes

Archive

Earlier years: 2026 · 2025 · 2024 · 2023

St. Catharines in brief

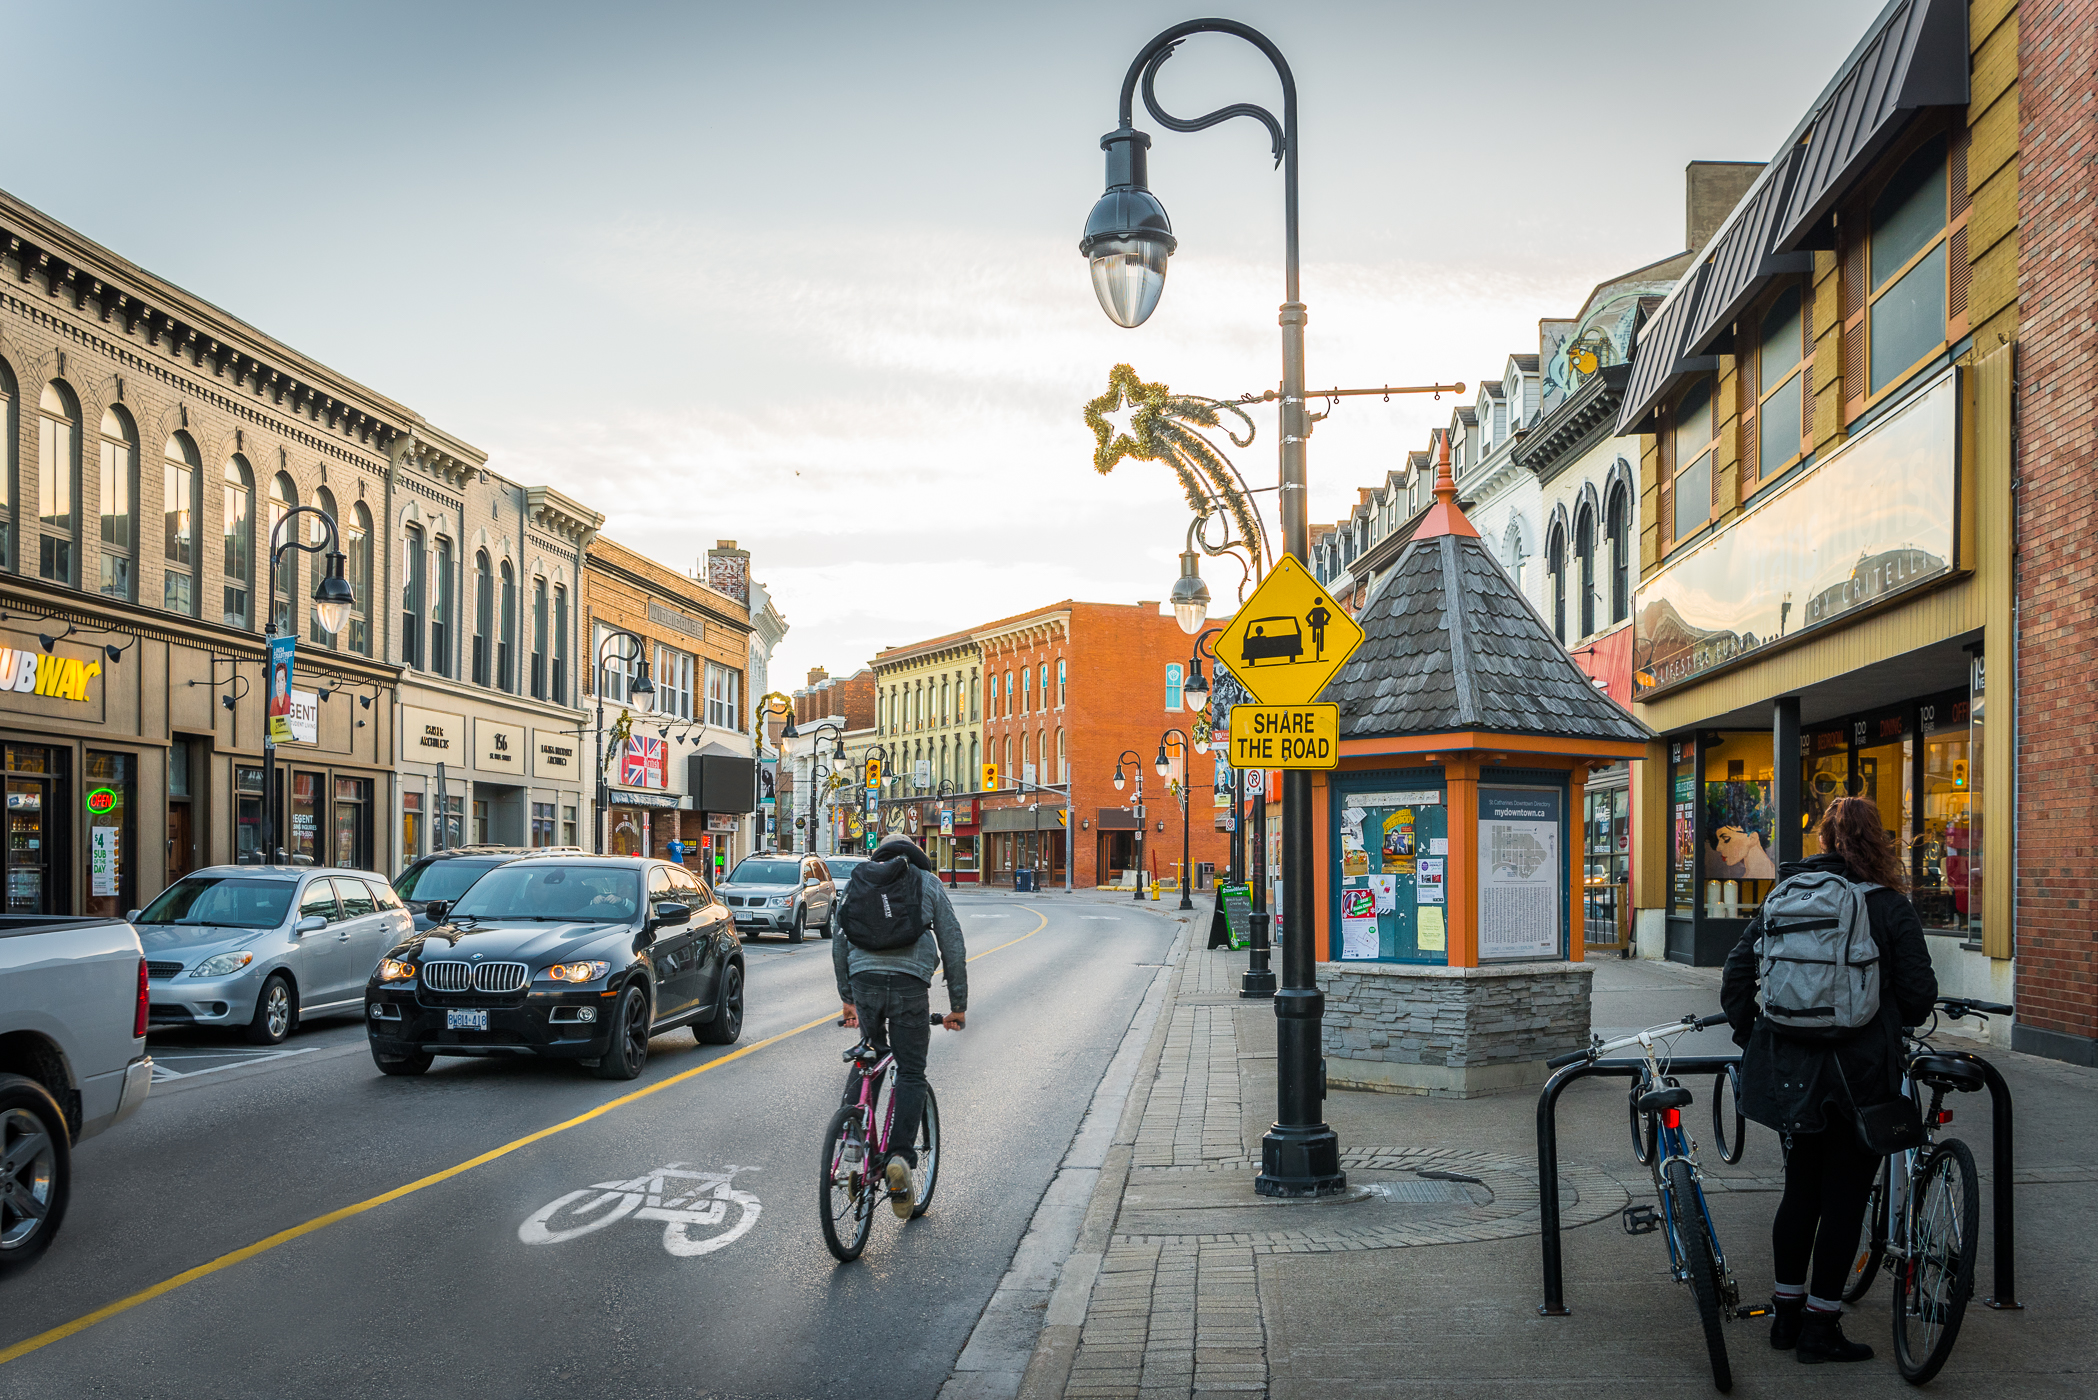
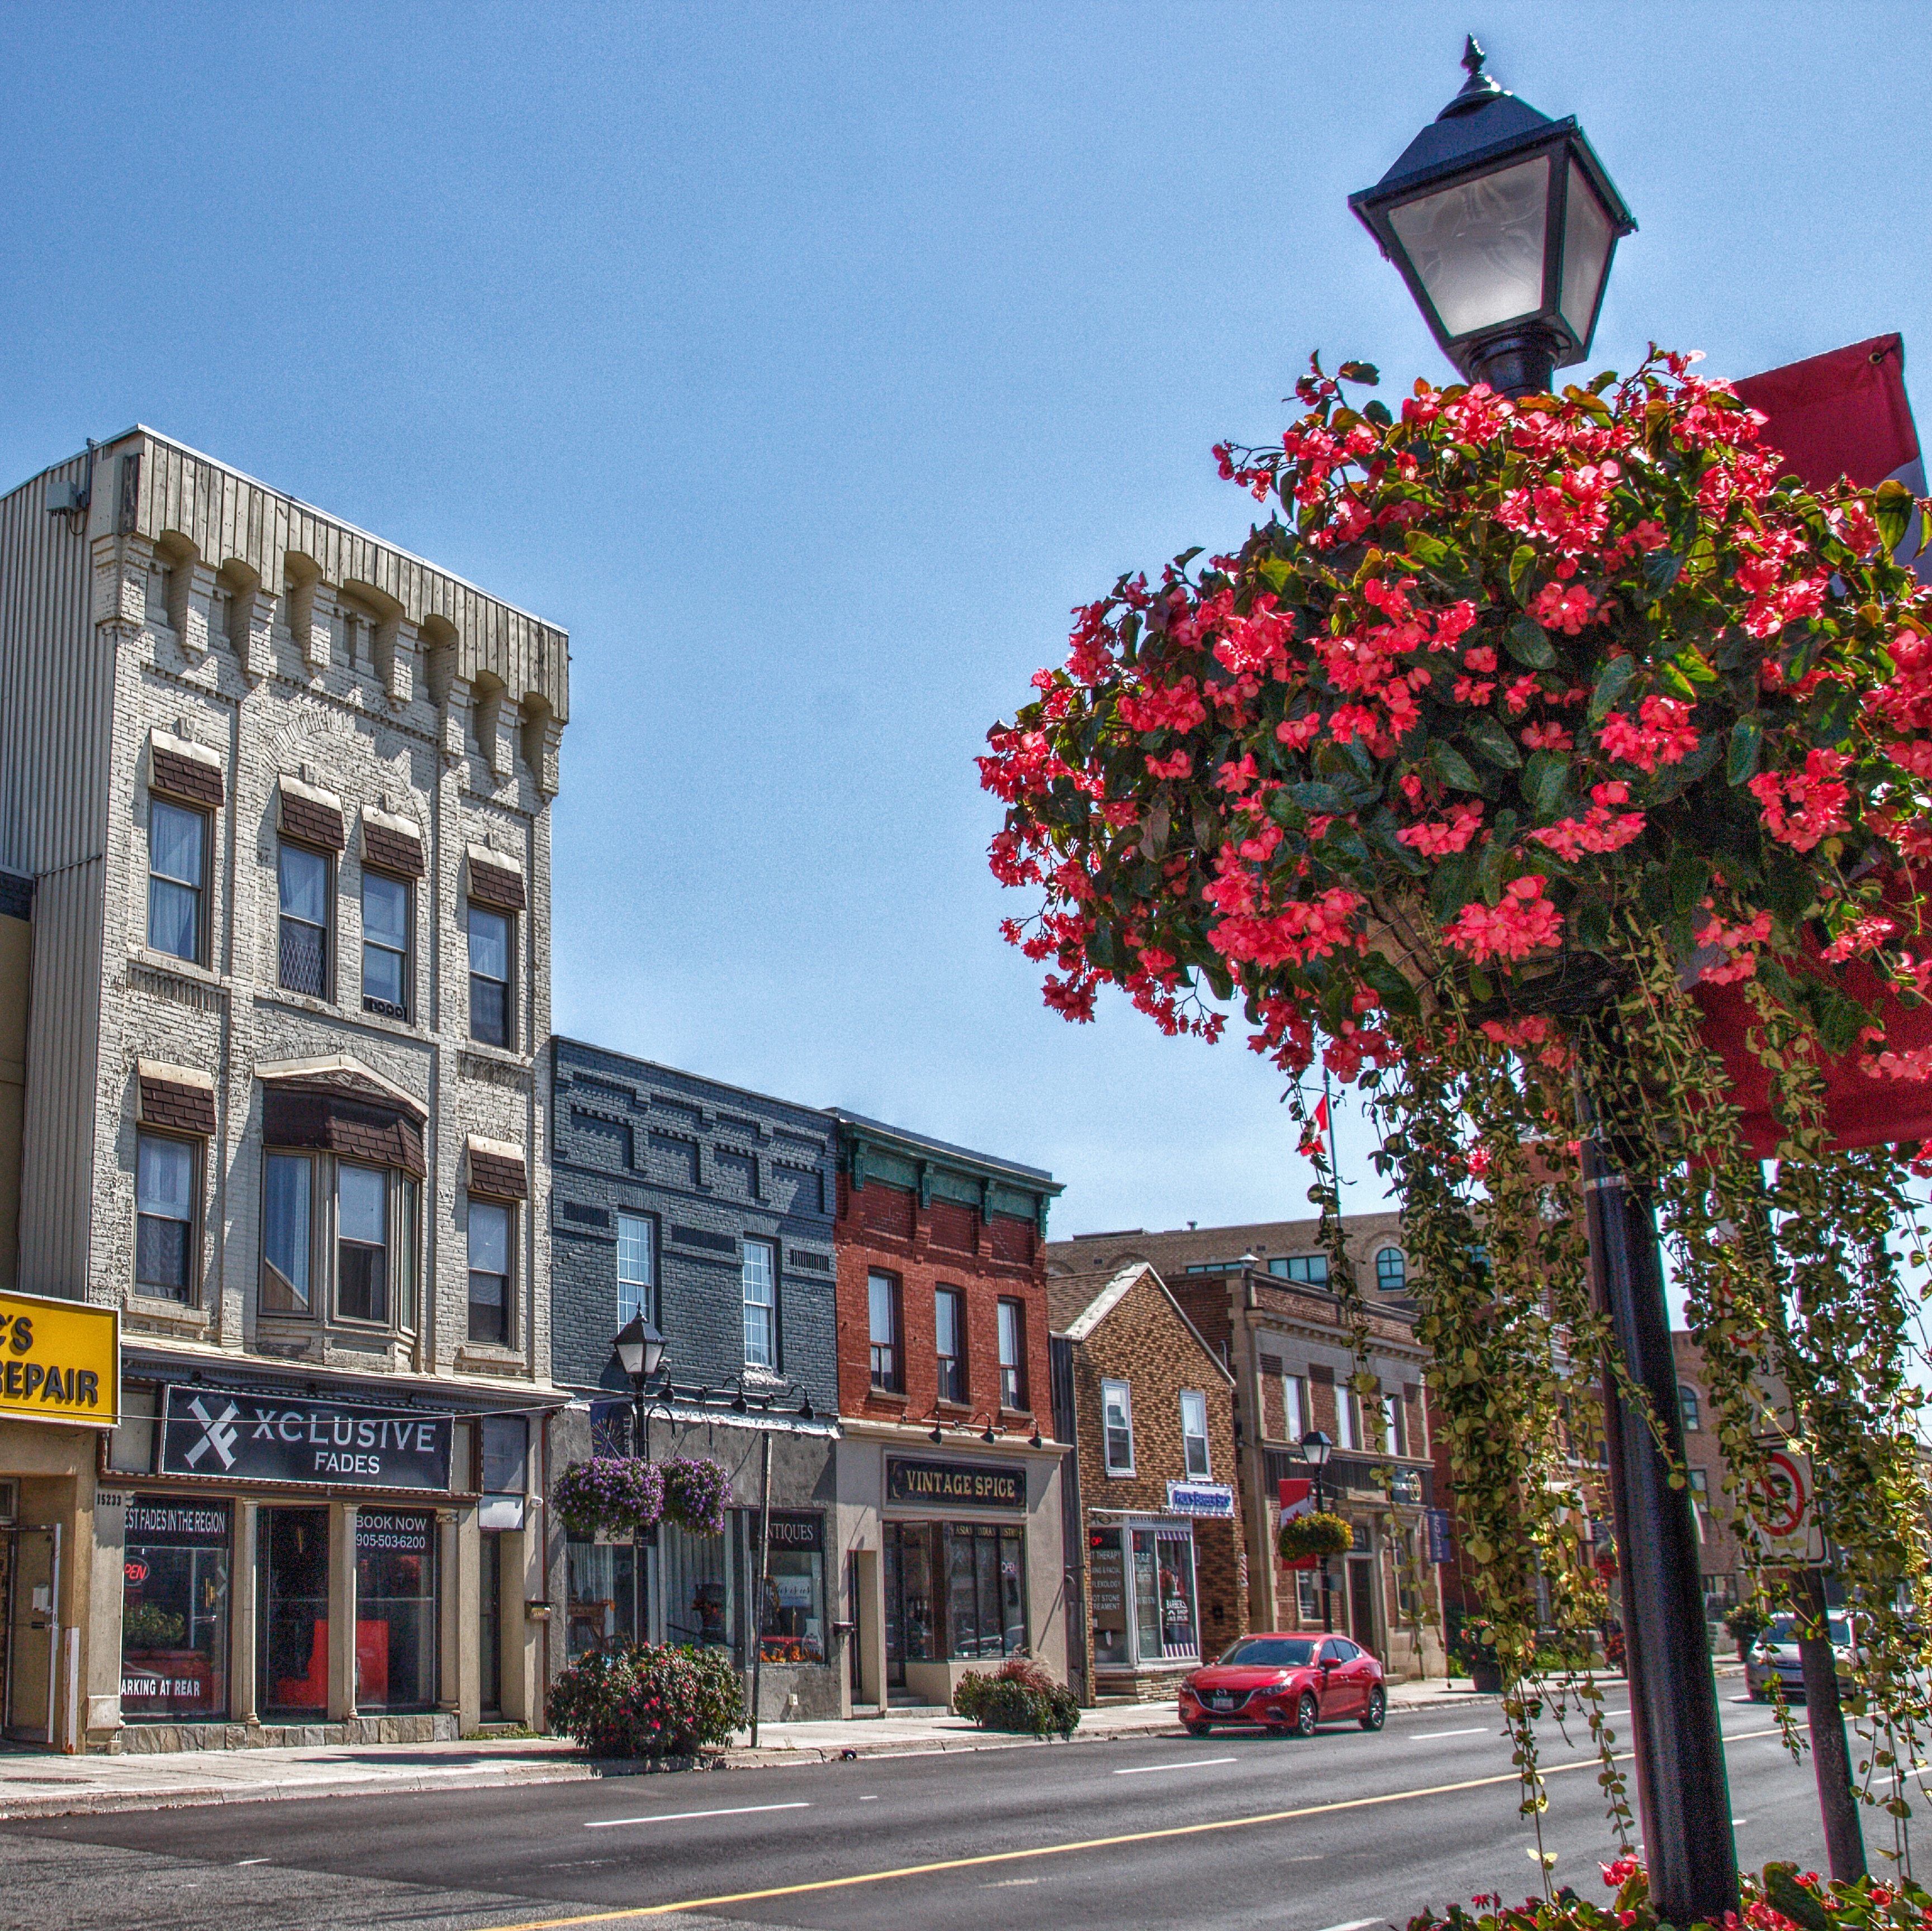
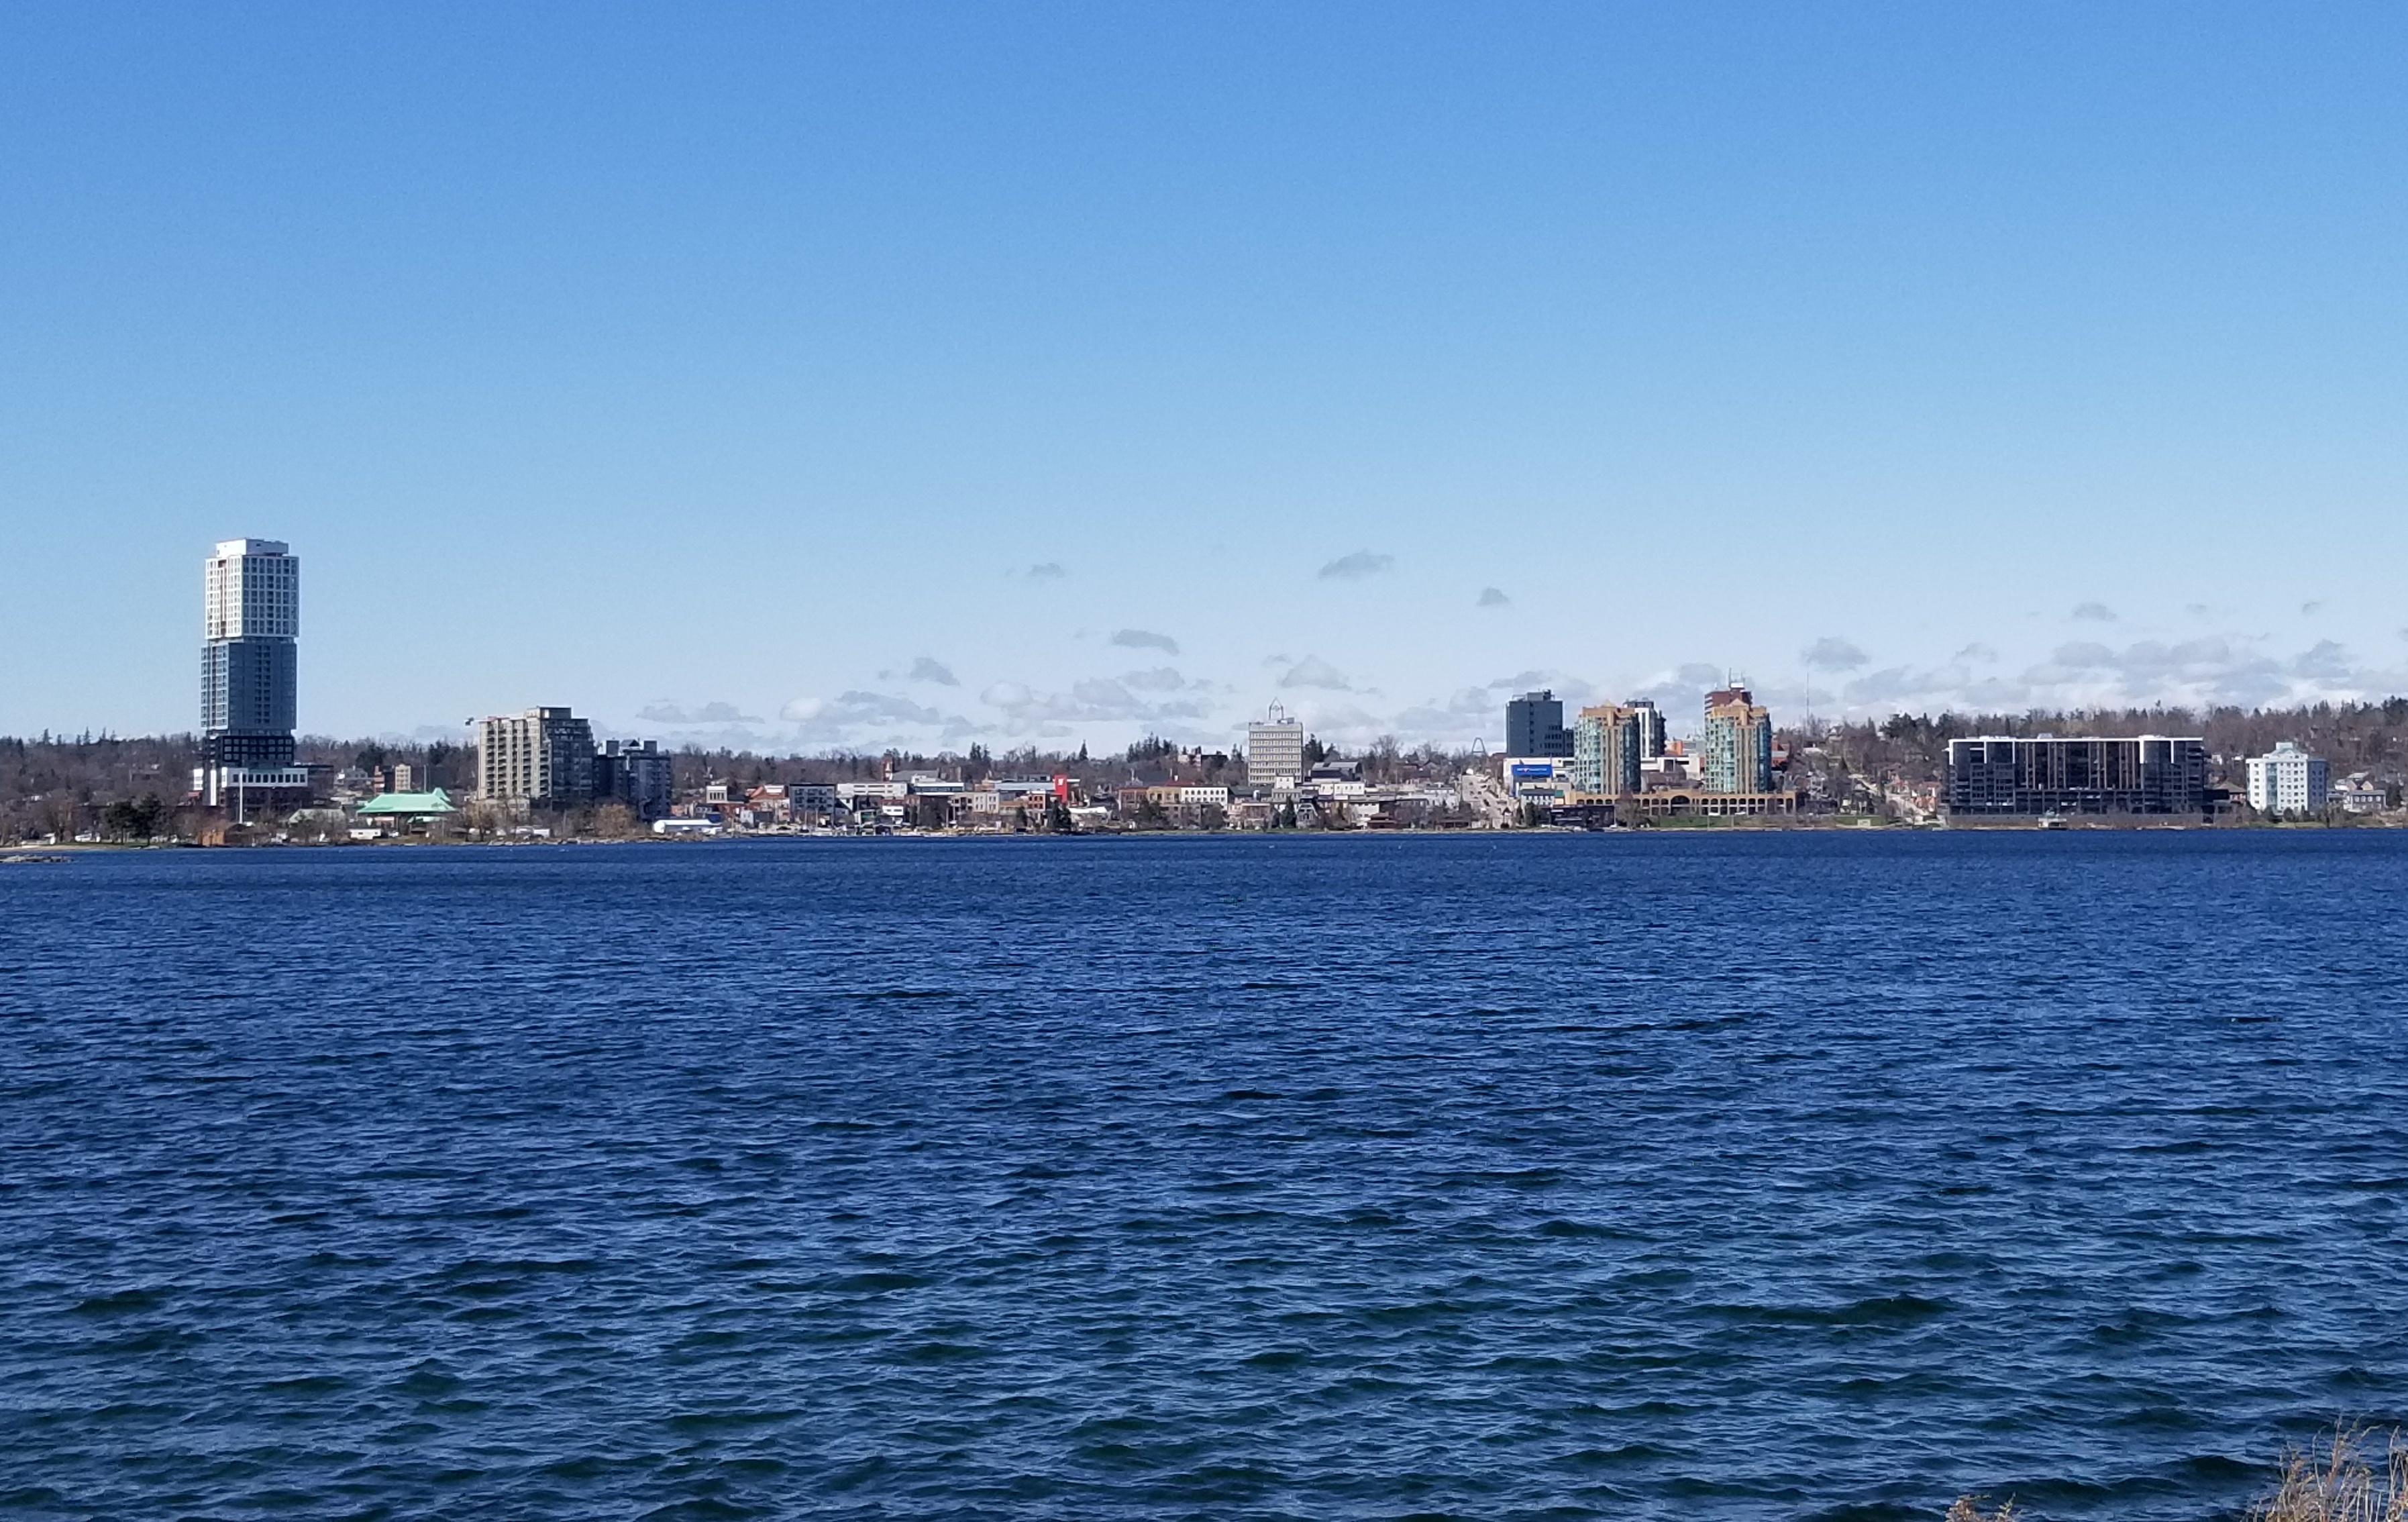
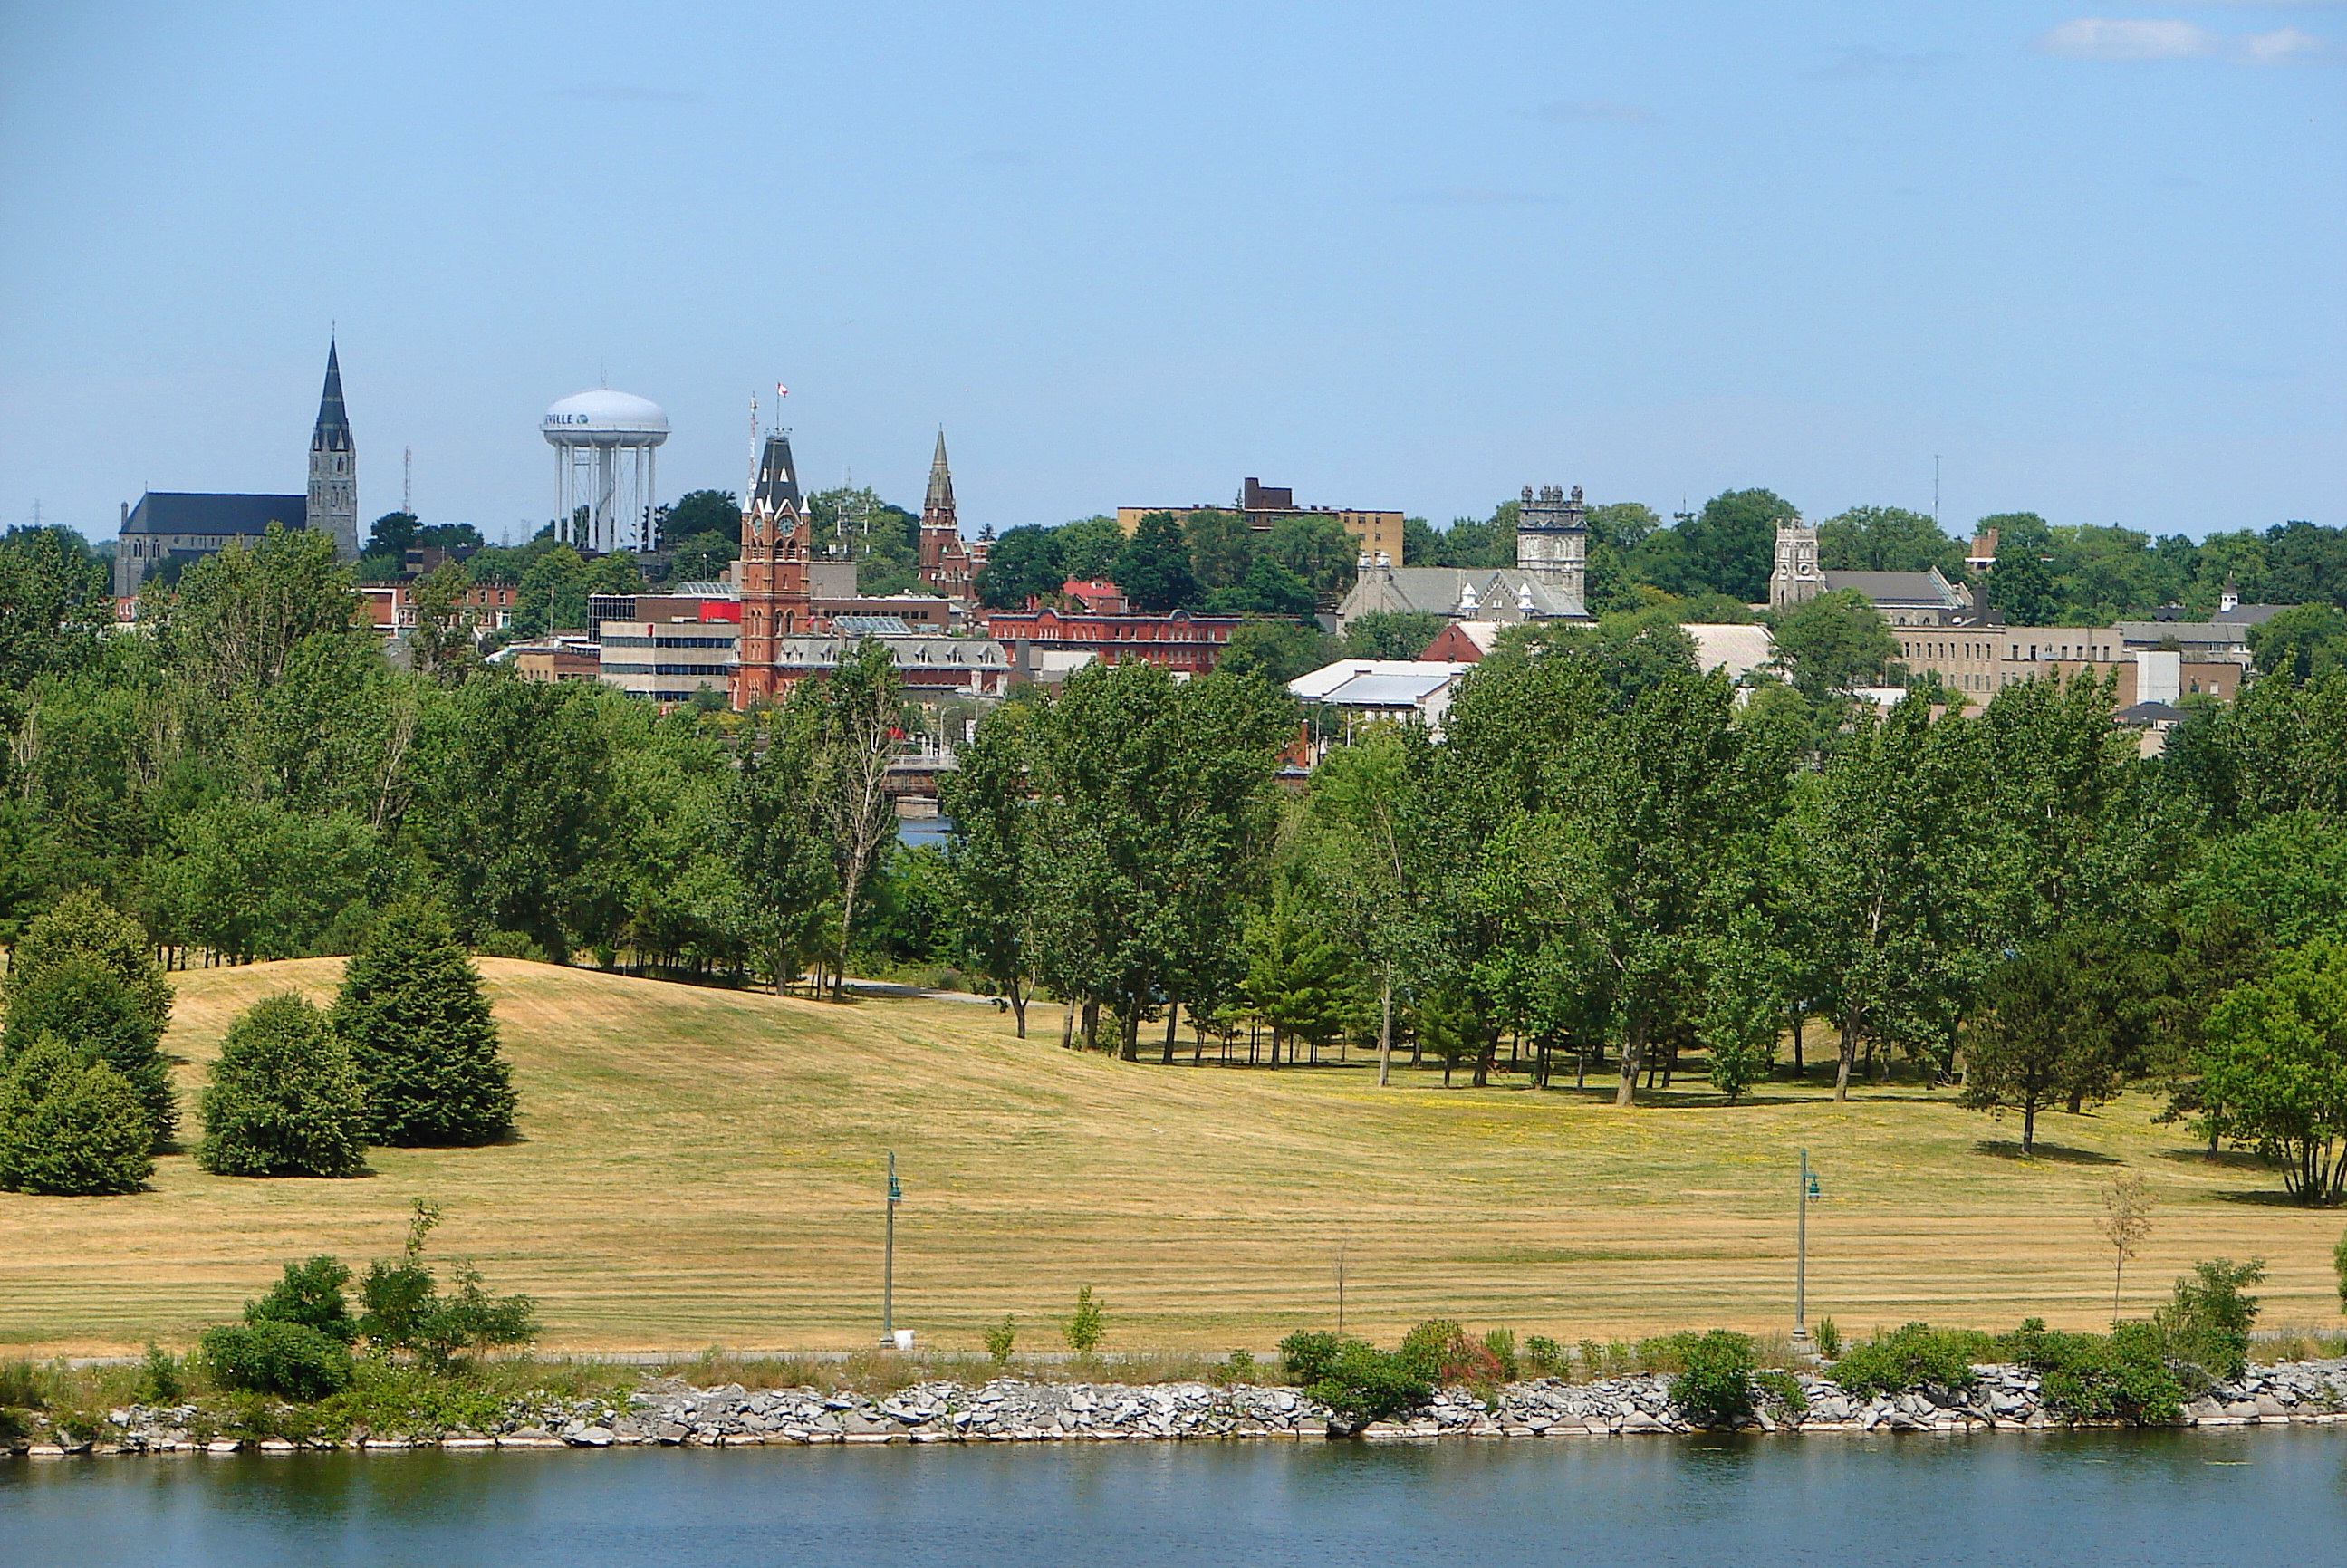
St. Catharines calls itself the Garden City, and the nickname still fits how people give directions. Port Dalhousie sits on the peninsula between Martindale Pond and Lake Ontario, with Lakeside Park Beach looking out to the harbour and lighthouse, the carousel turning for kids, and the Great Lakes Waterfront Trail underfoot. Sunset Beach stretches a long sandy run farther east, while quieter Jones Beach ties into the Welland Canals Trail. Tourism tags the place #LoveSTC and keeps downtown patio crawls and Niagara wine-country edges on the same weekend map.

Canal geography is not a museum afterthought. The St. Catharines Museum and Welland Canals Centre at Lock 3 pairs exhibits with ship viewing, and walking tours still trace early canal routes through Port Dalhousie streets like Lakeport Road and Lock Street. Western Hill, west of Twelve Mile Creek, gets its own museum nights for industries and neighbourhood haunts. The Meridian Centre and Niagara IceDogs community ticket programs keep arena talk in the municipal feed beside Fairview Mall shopping notes.

Weather can rewrite the week. City alerts in summer 2026 led with flooding response, a state of emergency, and Niagara Region partners on waste and recovery after heavy storms. That file sits beside beach strategy work on parking, litter, and crowd management at Lakeside and Sunset. On OpenStats City Score for 2026, St. Catharines sits at rank 35 of 125. Locals still introduce the hometown as Garden City first, then Port Dalhousie, then Lock 3.

Drawn from City of St. Catharines - Beaches, Port Dalhousie Heritage District, St. Catharines Museum and Welland Canals Centre, Visit St. Catharines, City of St. Catharines.

City Score over time

City Score from 2016–2025 across eight open-data pillars. Individual study placements are listed in the panels below.

0%25%50%75%100%2016201720182019202020212022202320242025
OpenStats City Score

Rankings for St. Catharines

Each study below is its own ranking. Where a study has more than one edition for this city, the chart shows standing across those years only.

Connectivity · OpenStats

OpenStats Broadband Download Speeds

OpenStats

Cities ranked by estimated best advertised download (Mbps). Anchored to the current ISED National Broadband Data vintage, then backcast along a national speed curve with city-specific fiber-arrival and 50/10 availability paths so relative ranks can change over the decade. Not a claim of audited historical hex maps for every year.

10 editions · 2016–2025

#10
Latest · 2025 · of 172
Score 58.9

Construction · OpenStats

OpenStats Building Permit Value

OpenStats

Cities ranked by calendar-year building permit value. Direct rows sum Statistics Canada Table 34-10-0292-01. Cities without a direct reading use population × provincial per-capita permit intensity (estimated), so every seed city has a year-varying construction signal.

10 editions · 2016–2025

#12
Latest · 2025 · of 172
Score 3124746000

sports · OpenStats

OpenStats CHL Points Percentage

OpenStats

Cities with a Canadian Hockey League club ranked by regular-season points percentage (best club wins if several). Rank 1 = highest points %. Built from CHL standings and Wikipedia season pages. Cities without a CHL club are omitted.

8 editions · 2017–2025

#34
Latest · 2025 · of 51
Score 0.485

Composite · OpenStats

OpenStats City Score

OpenStats

Dimensional average of OpenStats open-data pillars for each panel year 2016–2025: tax, construction, connectivity, indoor air, water, seismic hazard, population growth, and crime severity. Each series is scored 0–1 within its edition; series in the same pillar are averaged, then all eight pillars are averaged with equal weight. Missing pillars score at median standing (0.5). Growth and CSI use StatCan annual tables; permits, mill rates, and broadband use live rows plus documented year-varying estimates where needed. Radon, water, and PGA may be survey/model vintages carried forward and are flagged when static for more than two years. External commercial livability lists are never inputs.

10 editions · 2016–2025

#10
Latest · 2025 · of 172
Score 0.629

Safety · OpenStats

OpenStats Crime Severity Index

OpenStats

Communities ranked by Statistics Canada Crime Severity Index (Table 35-10-0026-01). Rank 1 is highest CSI (worse). Values are CMA where a metro match exists, otherwise provincial CSI. Hometown pages label the grain.

10 editions · 2016–2025

#155
Latest · 2025 · of 172
Score 53.84

Water · OpenStats

OpenStats Drinking Water Hardness

OpenStats

Communities ranked by municipal drinking-water hardness (mg/L as CaCO₃). Hardness changes slowly; the atlas vintage is carried across panel years and flagged when static for more than two years.

10 editions · 2016–2025

#68
Latest · 2025 · of 172
Score 182

Health · OpenStats

OpenStats Highest Indoor Radon

OpenStats

Communities ranked by Health Canada survey mean indoor radon (Bq/m³). Rank 1 is the highest mean. Decade panel years without a new survey carry the CMA survey vintage forward; they are not annual retests.

10 editions · 2016–2025

#101
Latest · 2025 · of 117
Score 57.3

sports · OpenStats

OpenStats Local Sports Depth

OpenStats

Cities ranked by weighted count of documented local teams (pro, junior, university, high-school hubs). Rank 1 = deepest documented sports footprint among covered seed cities. Not a claim about on-field success. See sports methodology for weights and gaps.

Single edition · 2025

#14
Published · 2025 · of 172
Score 17

Only one published edition places St. Catharines in this study so far. Open the edition for method notes and the full table.

Original source · Full edition

Growth · OpenStats

OpenStats Population Growth

OpenStats

Cities ranked by year-over-year population growth from Statistics Canada annual CSD estimates (Table 17-10-0155-01). Rank 1 is fastest growth. A few places without a clean CSD match use a provincial-path estimate anchored to seed population.

10 editions · 2016–2025

#80
Latest · 2025 · of 172
Score 0.012269736842105264

Property tax · OpenStats

OpenStats Residential Mill Rates

OpenStats

Municipalities ranked by residential mill rate. Rank 1 is the highest rate. Published municipal years are used when available; gaps are interpolated or follow the provincial median path so the tax pillar moves year to year for every city.

10 editions · 2016–2025

#42
Latest · 2025 · of 172
Score 13.228793342579749

Hazards · OpenStats

OpenStats Seismic Hazard (PGA)

OpenStats

Communities ranked by NRCan peak ground acceleration (higher = stronger shaking hazard). Rank 1 is highest PGA. The seismic model is multi-year; values are carried across the City Score panel and flagged as static until NRCan publishes a new generation.

10 editions · 2016–2025

#51
Latest · 2025 · of 172
Score 0.099

Housing

CMHC Average 2-Bedroom Rent — Lowest Rent

Canada Mortgage and Housing Corporation

Average rent for purpose-built 2-bedroom apartments (all tenants) from CMHC Rental Market Survey. Rank 1 = lowest average rent among covered CMAs.

Single edition · 2025

#6
Published · 2025 · of 18
Score 1527

Only one published edition places St. Catharines in this study so far. Open the edition for method notes and the full table.

Original source · Full edition

Worth knowing in St. Catharines

Distinctive local notes and places, each linked to its source.

Places to see

Lakeside Park Beach

Port Dalhousie beach with harbour and lighthouse views, carousel, playground, and Waterfront Trail access. It is the most postcard corner of the city's shoreline.

Port Dalhousie Heritage District

Peninsula neighbourhood between Martindale Pond and Lake Ontario, with carousel and Inner Range Lighthouse on the attraction list. Canal-era streetscapes still set the tone.

Follow St. Catharines by email

When St. Catharines moves in a ranking, posts new permit figures, or lands in a study, get a short note. A few sends a year, only when something changes.

No spam. Unsubscribe with one reply.

Related guides

More places in Ontario

All Ontario cities