Quebec

Gatineau

OpenStats City Score, ranking history, and local readings for Gatineau.

Rising+18

City Score #112 (2022) → #94 (2025)

How Gatineau scores

Rising+18

Gatineau sits at City Score rank #94 with a standing of 48%, from 8 of 8 open-data pillars (tax, construction, connectivity, indoor air, water, seismic hazard, growth, safety). Missing pillars score at median standing so thin coverage cannot inflate the rank. Rising 18 places versus 2022 (#112 → #94).

Latest owned placements: building permit value rank #29 of 172 (2025); indoor radon rank #58 of 117 at 112 Bq/m³ survey mean; residential mill rate rank #96 of 172 (10.23 mill rate). Full tables and method notes live on each study edition; atlas readings for the same slug open from the topic buttons.

#94
City Score rank
48%
City Score
Rising+18
vs 2022
#112 → #94

Local readings for Gatineau

Open each topic for Gatineau.

See where Gatineau water comes from

Local sports in Gatineau

Documented pro, junior, university, and high-school teams tied to Gatineau.

Hometown notes

Archive

Earlier years: 2026 · 2025 · 2024 · 2023

Gatineau in brief

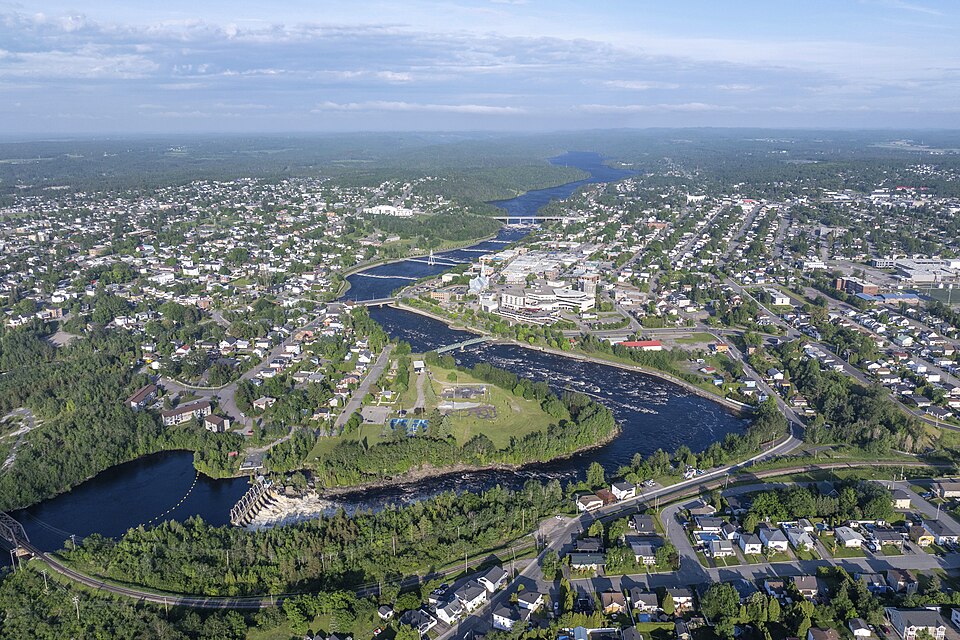
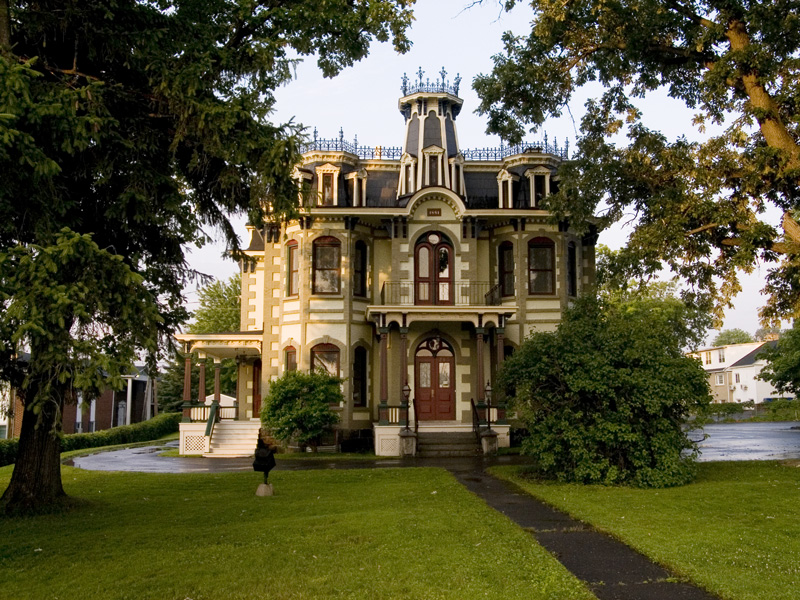
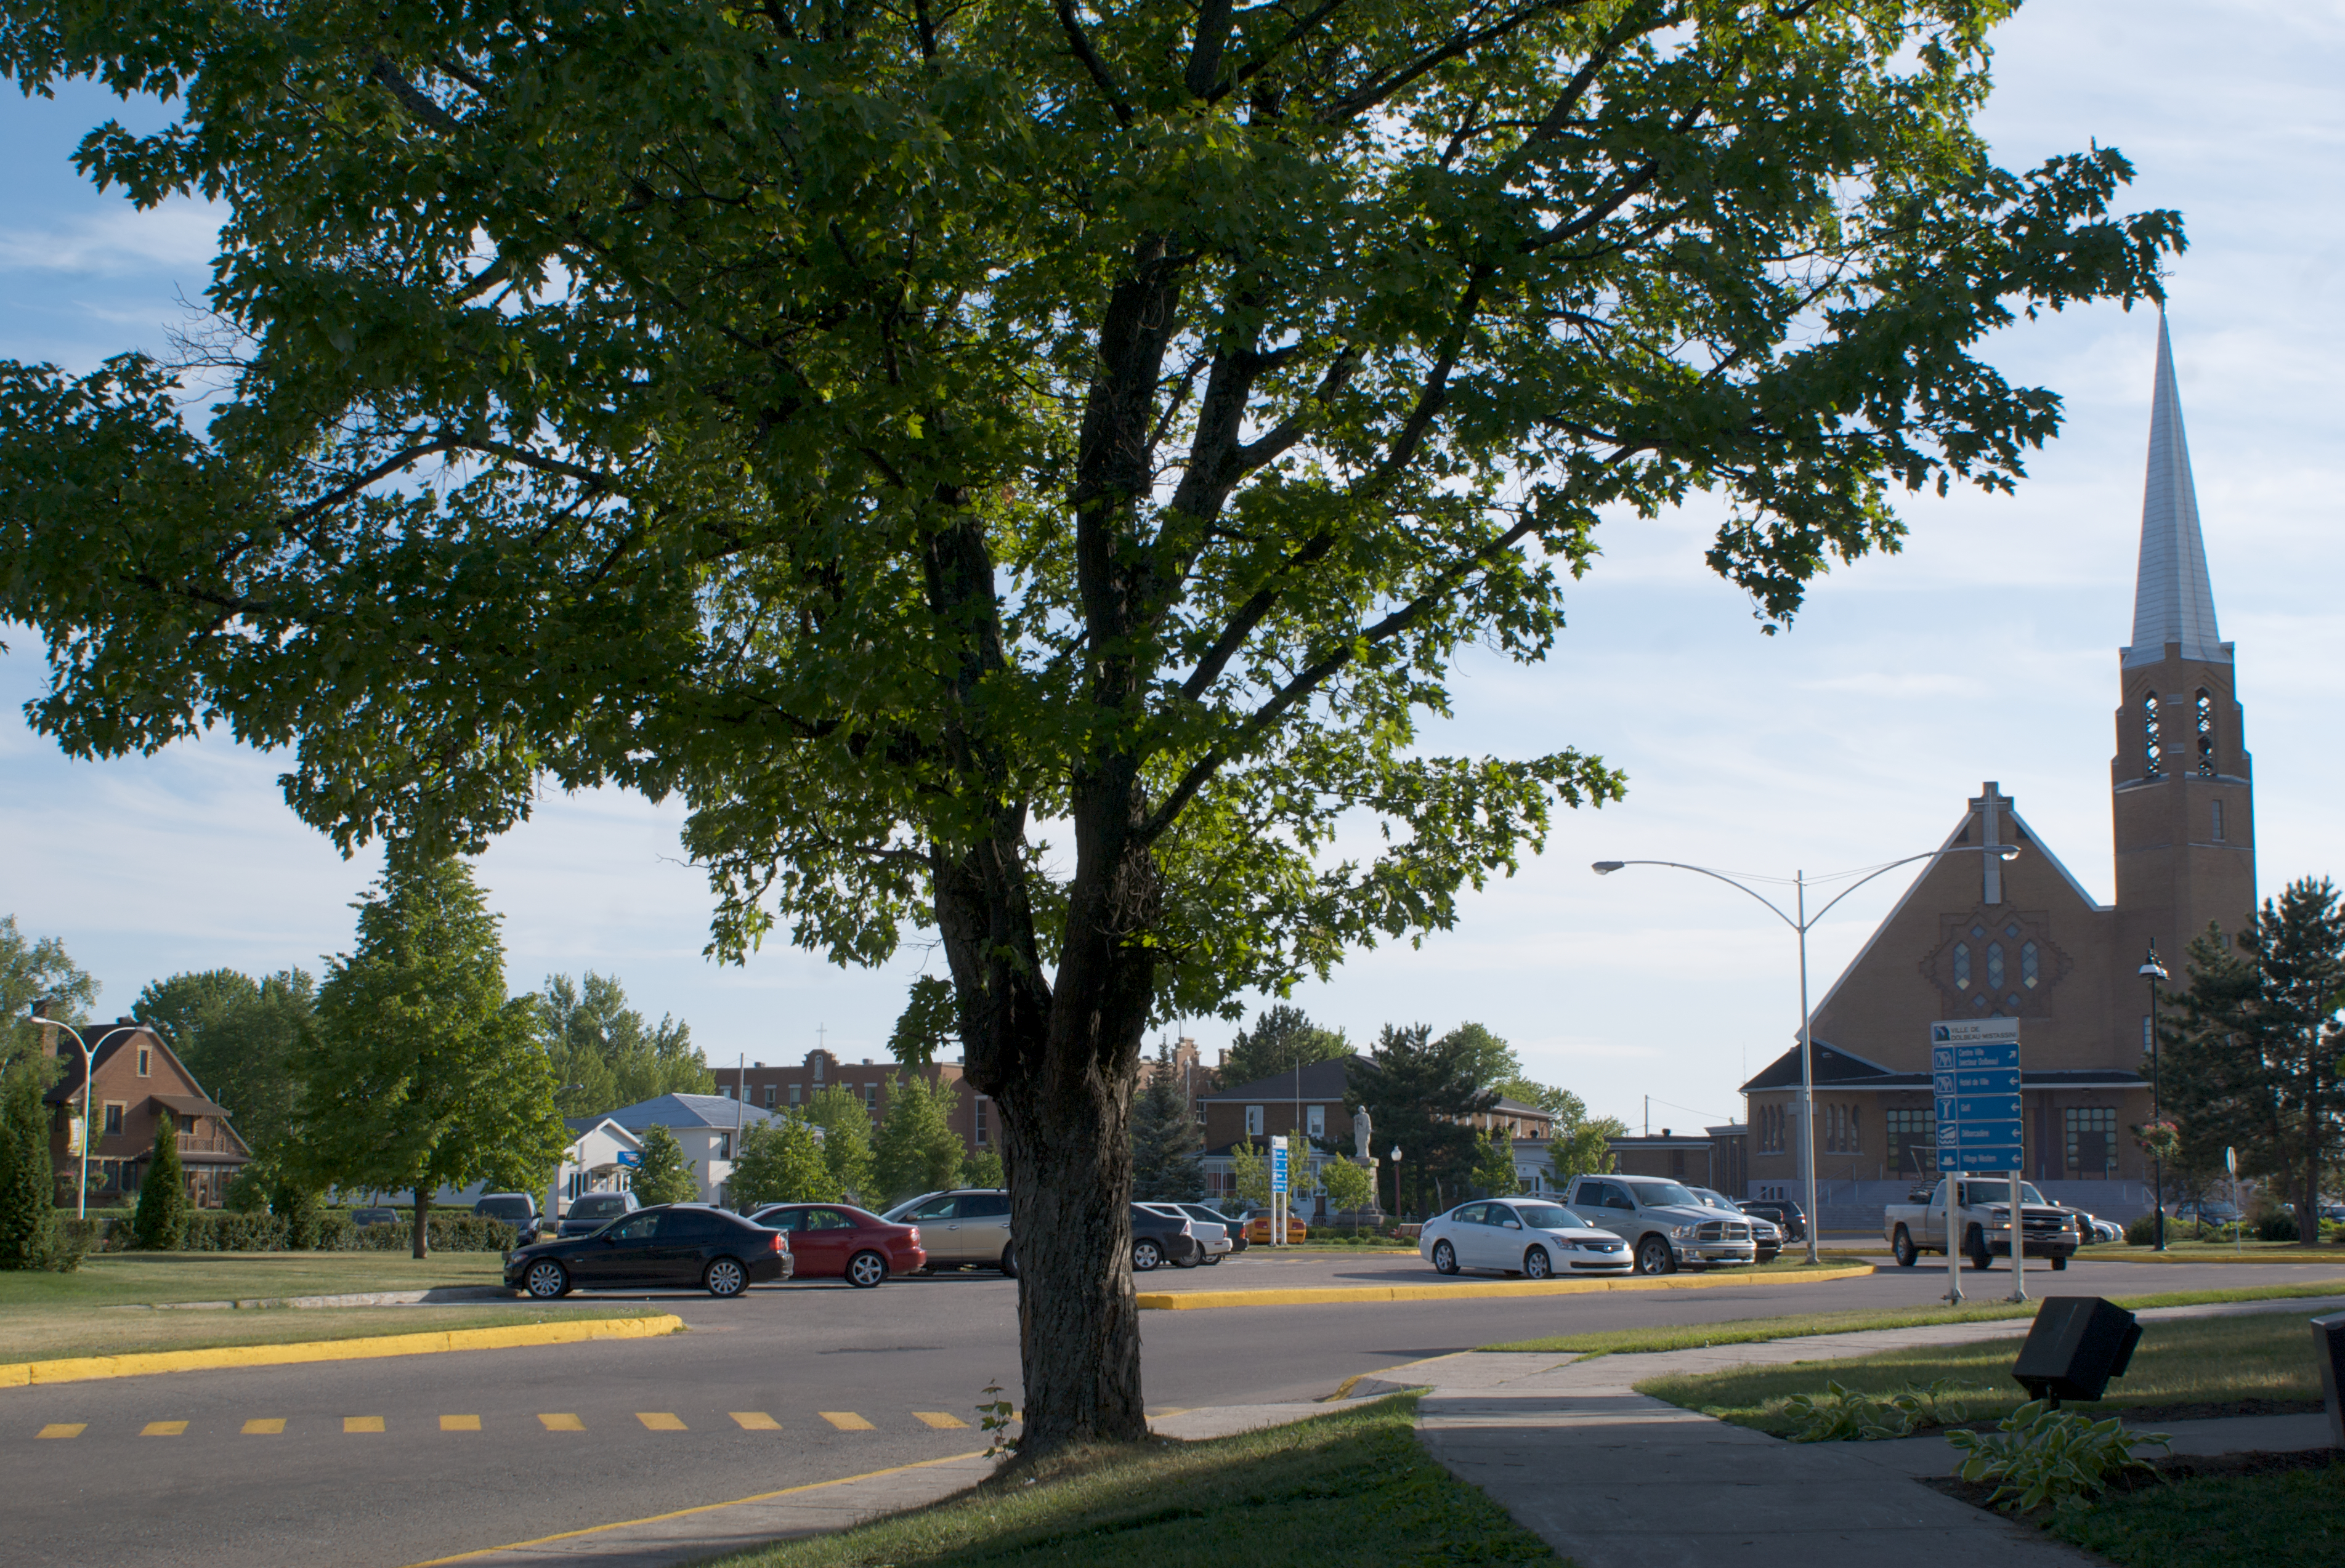
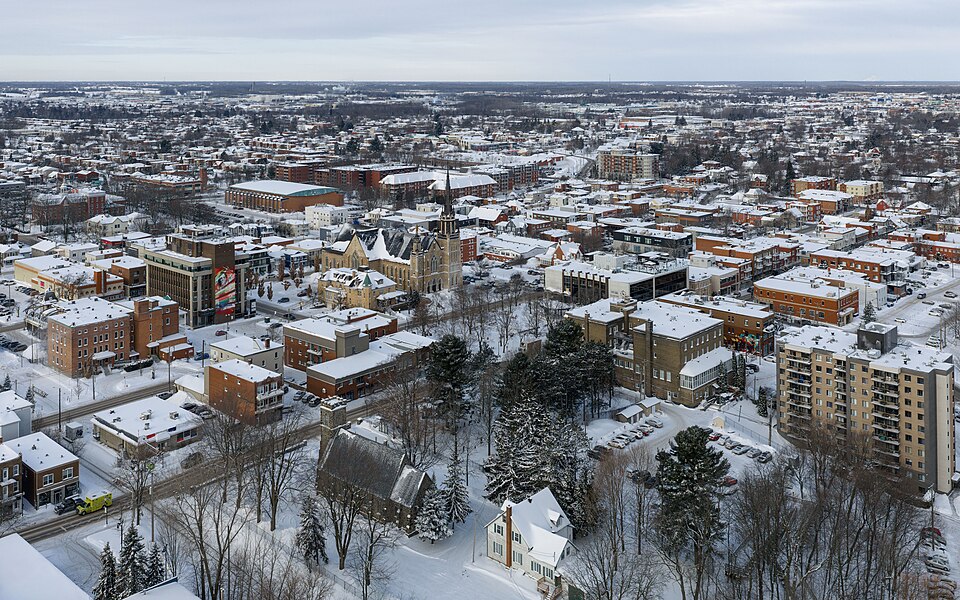
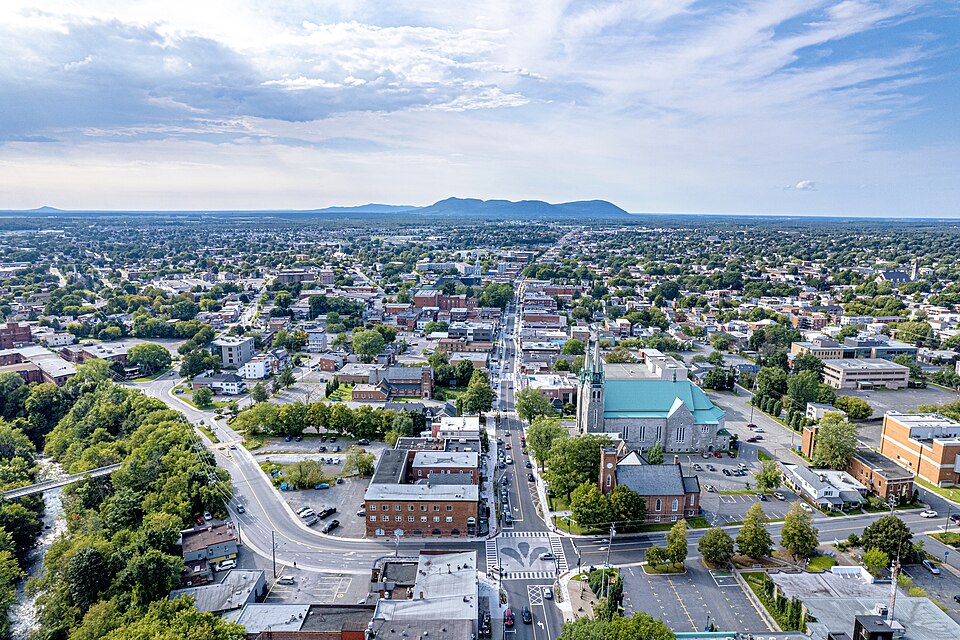
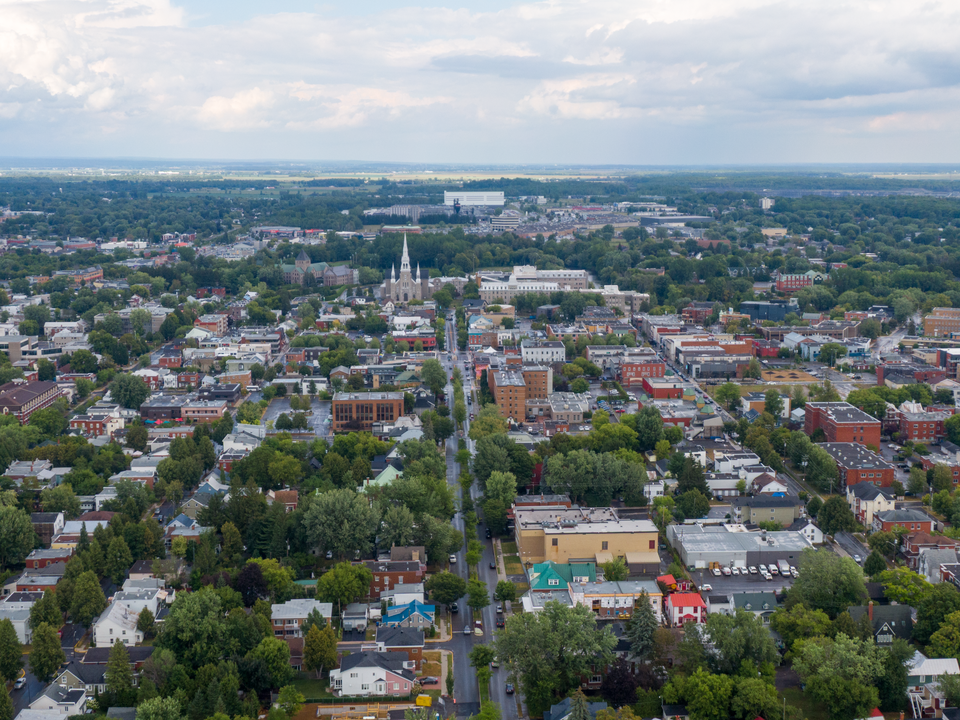
Gatineau is still five cities in one conversation. Locals navigate by Hull, Aylmer, Buckingham, Masson-Angers, and the Gatineau sector itself, the 2002 merger map that never left everyday speech. The rivière des Outaouais is the front porch facing Ottawa. The rivière Gatineau splits the east-west sprawl. Gatineau pour la vie is the municipal living brand, but the lived identity is Outaouais first: a Quebec shore that works across bridges, keeps French as the default, and still shops the capital-region calendar.

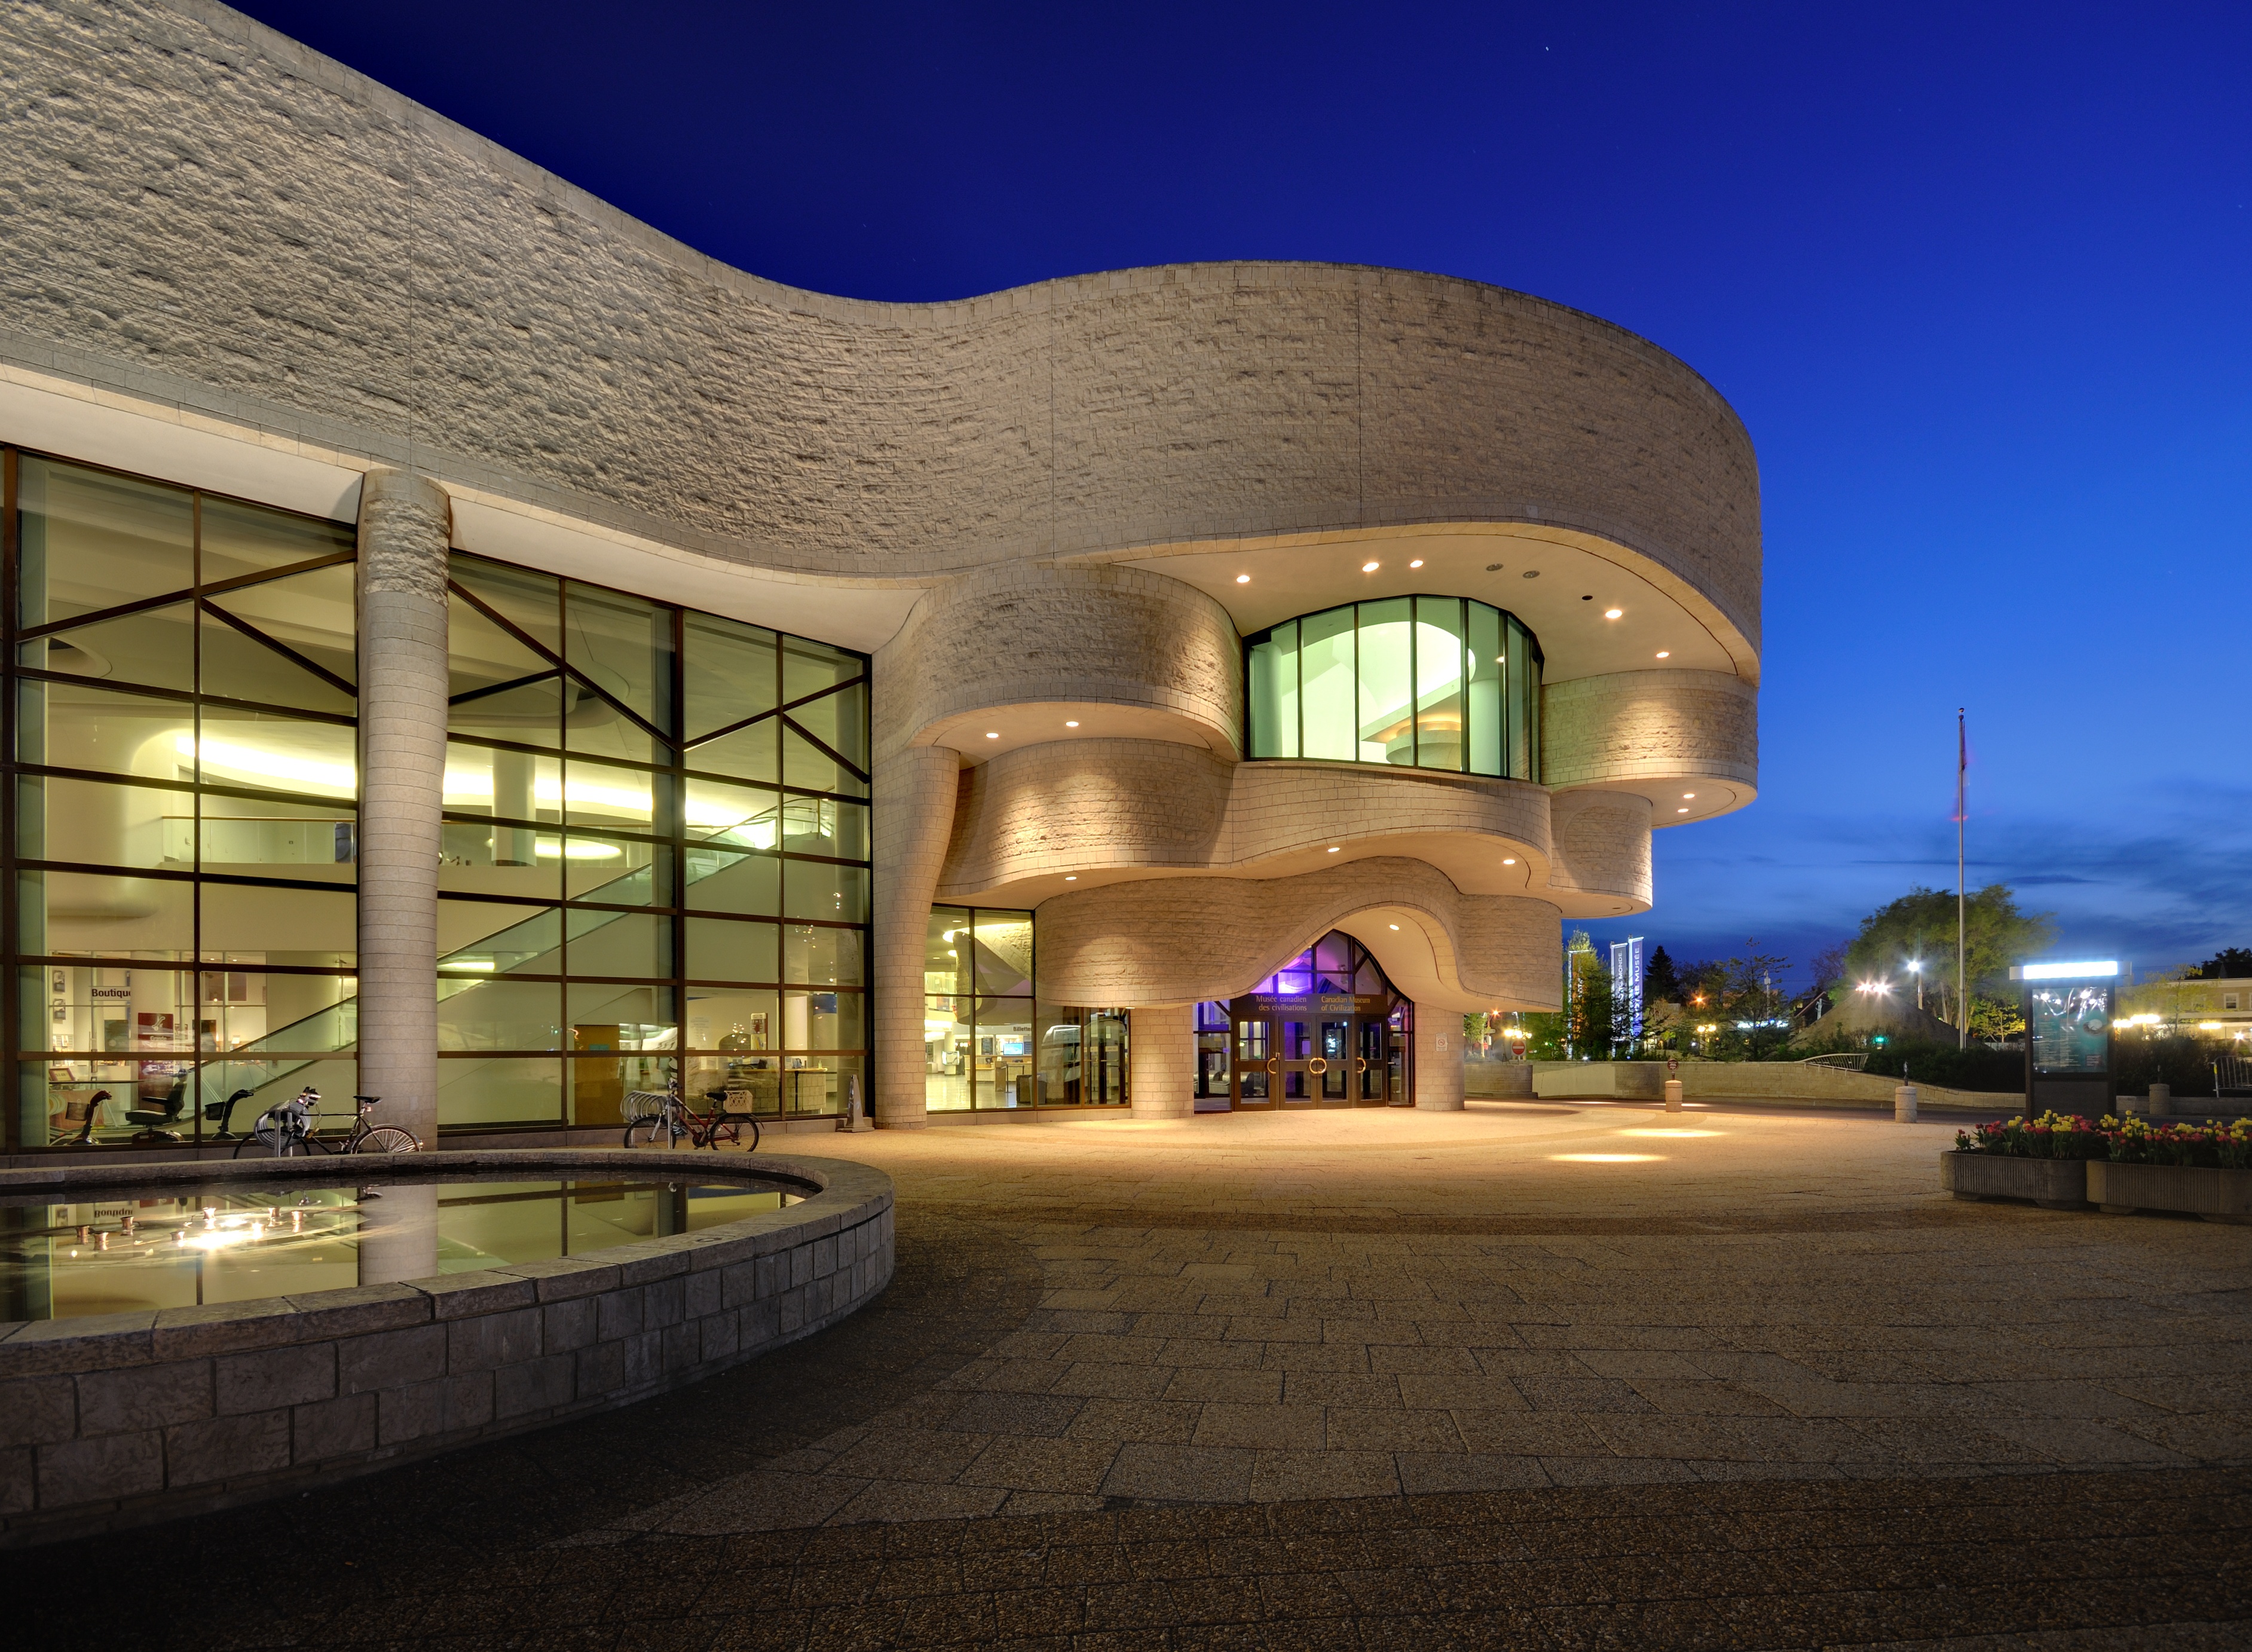
Hull carries the national skyline piece. Musée canadien de l'histoire sits on the waterfront, Vieux-Hull keeps an artsier pocket, and sentier des Voyageurs plus sentier du Ruisseau-de-la-Brasserie give walkers a shoreline grammar after office hours. Aylmer leans residential and river-facing. Buckingham and Masson-Angers keep a village pace inside the big-city envelope. Between them, Rapibus stitches commuting, while Université du Québec en Outaouais keeps student life on the Quebec side of Ottawa-Gatineau instead of treating the river as a one-way drain.

Weekends pull toward parc de la Gatineau trails, parc du Lac-Beauchamp, and the expérience gatinoise of bikes and ski tracks that tourism pages refuse to treat as optional scenery. Festival de montgolfières de Gatineau fills late summer, Tour de Gatineau brings elite cycling, and Maison de la culture's salle Odyssée holds the indoor stage when weather turns. It is a capital-region city that insists on naming its secteurs before anyone collapses them into a single suburb label. Le Droit keeps the Outaouais conversation loud, but the street-level grammar stays secteurs, bridges, Rapibus, and parc de la Gatineau trailheads after supper.

Drawn from Ville de Gatineau, Tourisme Outaouais, Le Droit.

City Score over time

City Score from 2016–2025 across eight open-data pillars. Individual study placements are listed in the panels below.

0%25%50%75%100%2016201720182019202020212022202320242025
OpenStats City Score

Rankings for Gatineau

Each study below is its own ranking. Where a study has more than one edition for this city, the chart shows standing across those years only.

Connectivity · OpenStats

OpenStats Broadband Download Speeds

OpenStats

Cities ranked by estimated best advertised download (Mbps). Anchored to the current ISED National Broadband Data vintage, then backcast along a national speed curve with city-specific fiber-arrival and 50/10 availability paths so relative ranks can change over the decade. Not a claim of audited historical hex maps for every year.

10 editions · 2016–2025

#137
Latest · 2025 · of 172
Score 41.5

Construction · OpenStats

OpenStats Building Permit Value

OpenStats

Cities ranked by calendar-year building permit value. Direct rows sum Statistics Canada Table 34-10-0292-01. Cities without a direct reading use population × provincial per-capita permit intensity (estimated), so every seed city has a year-varying construction signal.

10 editions · 2016–2025

#29
Latest · 2025 · of 172
Score 1138444000

sports · OpenStats

OpenStats CHL Points Percentage

OpenStats

Cities with a Canadian Hockey League club ranked by regular-season points percentage (best club wins if several). Rank 1 = highest points %. Built from CHL standings and Wikipedia season pages. Cities without a CHL club are omitted.

8 editions · 2017–2025

#43
Latest · 2025 · of 51
Score 0.383

Composite · OpenStats

OpenStats City Score

OpenStats

Dimensional average of OpenStats open-data pillars for each panel year 2016–2025: tax, construction, connectivity, indoor air, water, seismic hazard, population growth, and crime severity. Each series is scored 0–1 within its edition; series in the same pillar are averaged, then all eight pillars are averaged with equal weight. Missing pillars score at median standing (0.5). Growth and CSI use StatCan annual tables; permits, mill rates, and broadband use live rows plus documented year-varying estimates where needed. Radon, water, and PGA may be survey/model vintages carried forward and are flagged when static for more than two years. External commercial livability lists are never inputs.

10 editions · 2016–2025

#94
Latest · 2025 · of 172
Score 0.477

Safety · OpenStats

OpenStats Crime Severity Index

OpenStats

Communities ranked by Statistics Canada Crime Severity Index (Table 35-10-0026-01). Rank 1 is highest CSI (worse). Values are CMA where a metro match exists, otherwise provincial CSI. Hometown pages label the grain.

10 editions · 2016–2025

#120
Latest · 2025 · of 172
Score 60.55

Water · OpenStats

OpenStats Drinking Water Hardness

OpenStats

Communities ranked by municipal drinking-water hardness (mg/L as CaCO₃). Hardness changes slowly; the atlas vintage is carried across panel years and flagged when static for more than two years.

10 editions · 2016–2025

#53
Latest · 2025 · of 172
Score 203

Health · OpenStats

OpenStats Highest Indoor Radon

OpenStats

Communities ranked by Health Canada survey mean indoor radon (Bq/m³). Rank 1 is the highest mean. Decade panel years without a new survey carry the CMA survey vintage forward; they are not annual retests.

10 editions · 2016–2025

#58
Latest · 2025 · of 117
Score 111.7

sports · OpenStats

OpenStats Local Sports Depth

OpenStats

Cities ranked by weighted count of documented local teams (pro, junior, university, high-school hubs). Rank 1 = deepest documented sports footprint among covered seed cities. Not a claim about on-field success. See sports methodology for weights and gaps.

Single edition · 2025

#40
Published · 2025 · of 172
Score 5

Only one published edition places Gatineau in this study so far. Open the edition for method notes and the full table.

Original source · Full edition

Growth · OpenStats

OpenStats Population Growth

OpenStats

Cities ranked by year-over-year population growth from Statistics Canada annual CSD estimates (Table 17-10-0155-01). Rank 1 is fastest growth. A few places without a clean CSD match use a provincial-path estimate anchored to seed population.

10 editions · 2016–2025

#109
Latest · 2025 · of 172
Score 0.008214458632921732

Property tax · OpenStats

OpenStats Residential Mill Rates

OpenStats

Municipalities ranked by residential mill rate. Rank 1 is the highest rate. Published municipal years are used when available; gaps are interpolated or follow the provincial median path so the tax pillar moves year to year for every city.

10 editions · 2016–2025

#96
Latest · 2025 · of 172
Score 10.233036949648538

Hazards · OpenStats

OpenStats Seismic Hazard (PGA)

OpenStats

Communities ranked by NRCan peak ground acceleration (higher = stronger shaking hazard). Rank 1 is highest PGA. The seismic model is multi-year; values are carried across the City Score panel and flagged as static until NRCan publishes a new generation.

10 editions · 2016–2025

#34
Latest · 2025 · of 172
Score 0.159

Housing

CMHC Average 2-Bedroom Rent — Lowest Rent

Canada Mortgage and Housing Corporation

Average rent for purpose-built 2-bedroom apartments (all tenants) from CMHC Rental Market Survey. Rank 1 = lowest average rent among covered CMAs.

Single edition · 2025

#4
Published · 2025 · of 18
Score 1460

Only one published edition places Gatineau in this study so far. Open the edition for method notes and the full table.

Original source · Full edition

Livability

Globe and Mail Most Livable Cities

The Globe and Mail

2023 data partnership with Environics Analytics ranking 439 Canadian communities on ten livability categories.

Single edition · 2023

#58
Published · 2023 · of 439

Only one published edition places Gatineau in this study so far. Open the edition for method notes and the full table.

Original source · Full edition

Worth knowing in Gatineau

Distinctive local notes and places, each linked to its source.

  • Everyday geography still uses the five secteurs: Aylmer, Hull, Gatineau, Buckingham, and Masson-Angers.

    Tourisme Outaouais

  • Musée canadien de l'histoire sits on the Hull waterfront and anchors visitor itineraries.

    Tourisme Outaouais

  • Festival de montgolfières de Gatineau is the city's marquee late-summer event.

    Tourisme Outaouais

  • Rapibus is the STO rapid-bus spine locals cite when explaining cross-sector commuting.

    Tourisme Outaouais

Places to see

Musée canadien de l'histoire

National museum on the Hull shore of the rivière des Outaouais. The building is part of how Gatineau explains itself to visitors from Ottawa.

parc de la Gatineau

Trail network for hiking and cross-country ski that defines the expérience gatinoise outdoors calendar.

Vieux-Hull

Artistic downtown pocket inside Hull, close to shoreline trails and the museum district.

Follow Gatineau by email

When Gatineau moves in a ranking, posts new permit figures, or lands in a study, get a short note. A few sends a year, only when something changes.

No spam. Unsubscribe with one reply.

Related guides

More places in Quebec

All Quebec cities